Increase Manufacturing Production Capacity

What Is Production Capacity?
Let's start with a simple definition. Production capacity is the maximum amount your manufacturing operation can produce. Capacity is increased either to meet an actual (immediate) increase in customer demand or an anticipated (future) increase in customer demand.
Immediate capacity increases are usually achieved by:
- Using existing equipment for more time (Adding shifts or overtime)
- Using someone else's equipment (Outsourcing)
Future capacity increases are usually achieved by:
- Using existing equipment more effectively (Improving)
- Purchasing new equipment (Spending)

Most equipment is not used anywhere near its true capacity. In fact, the difference between typical manufacturing (an OEE score of 60%) and best-in-class manufacturing (an OEE score of 85%) represents an astounding 41.6% increase in capacity. So, before thinking about adding shifts or overtime, outsourcing, or purchasing new equipment, make sure you truly understand and consider the untapped potential that exists in your current factory.
Untapped potential in your current factory can be broken into two categories, each of which represents a constraint on capacity:
- Equipment Losses: Capacity lost due to equipment running at less than its full potential.
- Schedule Losses: Capacity lost due to time that equipment is not schedule to run at all.
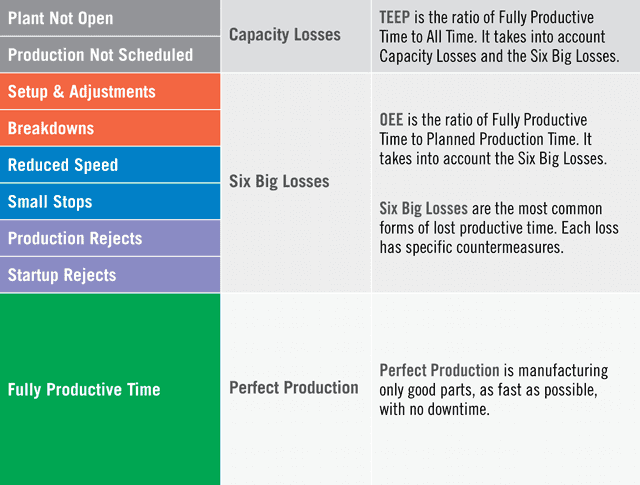
OEE, or Overall Equipment Effectiveness, is a well-established performance metric that takes into account Equipment Losses (usually broken into the categories of Availability Loss, Performance Loss, and Quality Loss; and further broken into the Six Big Losses as shown in the diagram below). OEE measures performance with respect to Planned Production Time (the percentage of Planned Production Time that is fully productive).
TEEP, or Total Effective Equipment Performance, is a well-established performance metric that takes into account Equipment Losses and Schedule Losses. It measures performance with respect to All Time (the percentage of All Time that is fully productive; All Time is sometimes referred to as Calendar Time or 24/7 Time).
Measuring OEE (with Equipment Losses broken into the Six Big Losses) and TEEP (with Schedule Losses) gives you a very complete picture of how much capacity is waiting to be unlocked in your “hidden factory”.
Measuring Capacity in Manufacturing
Accurately and objectively measuring your unused production capacity unlocks the potential to increase capacity. By measuring equipment and schedule losses, you can understand your lost production time and the gap between your current and theoretical maximum capacity. Knowing this gap and your capabilities allows you to set an achievable target capacity for your existing resources.
Here are some useful ways to think about unused capacity:
- Equipment Losses represent the first part of your hidden factory – additional capacity that can be unlocked by successfully applying best practice improvement tools to reach best-in-class OEE.
- Schedule Losses represent the second part of your hidden factory – additional capacity that can be unlocked by scheduling more production time.
And here are some useful ways to quantify capacity:
- Current Capacity is the amount you can produce using your equipment as is (at its current effectiveness) and within your current production schedule.
- Target Capacity is the amount you will produce when you reach your OEE target (reducing Equipment Losses) and schedule more production time (reducing Schedule Losses). Remember though – many manufacturers can improve capacity by as much as 40% simply through reducing Equipment Losses – so start there!
- Theoretical Capacity is the amount you would produce if there were no Equipment Losses and no Schedule Losses. It represents manufacturing only good parts, as fast as possible, with no down time, around the clock (24/7). It results in a TEEP score of 100%.
How to Leverage the Six Big Losses
A comprehensive and very practical way to address Equipment Losses is through the underlying Six Big Losses. The Six Big Losses are very well-aligned to discrete manufacturing and map to specific improvement tools and countermeasures. The Six Big Losses are:
- Setups and Adjustments (Planned Stops)
- Breakdowns (Unplanned Stops)
- Reduced Speed (Slow Cycles)
- Small Stops
- Production Rejects
- Startup Rejects
Improving manufacturing productivity leads to a “virtuous cycle” of increased capacity. More efficient equipment can be scheduled more accurately and for smaller lot sizes. This lowers cost and reduces lead times, which leads to more customer orders – which utilize the increased capacity.

Learn more about how to leverage the Six Big Losses in manufacturing.
Best Practices for Increased Capacity
There are two aspects of best practices to consider when increasing capacity:
- Information: Measuring OEE and TEEP.
- Action: Applying Theory of Constraints and Lean Manufacturing.
OEE is ideally suited for supervisors that want to benchmark and measure progress in reducing Equipment Losses. It provides one simple metric, the OEE score, with which to gauge progress. Even better, it aligns perfectly with the Six Big Losses to provide valuable insights on where to focus improvement efforts and what type of improvement actions will be most effective. We don't recommend OEE as the primary metric for operators – it is a bit too abstract. Instead, for the plant floor we recommend using real-time TAED (Target, Actual, Efficiency, and Down Time), which is driven by Takt Time.
TEEP is ideally suited for managers who have influence over when production equipment is run (e.g., production schedulers and senior factory management). TEEP works well as a proactive planning metric:
- If the factory is running at 14% TEEP (one shift running five days a week with an average OEE score of 60%) there is a lot of room for alternatives to purchasing new equipment.
- If the factory is running at 85% TEEP (three shifts running seven days a week with an average OEE score of 85%) new equipment may be a necessity.
Theory of Constraints is a collection of improvement techniques based on the idea that every manufacturing process has a constraint that acts as a fulcrum (point of leverage) for the entire process. Focusing improvement efforts on the constraint helps ensure that resources are optimized and is often one of the fastest routes to increased capacity. Emphasizing the constraint focuses teams and can quickly unlock additional capacity at the manufacturing process bottleneck. Theory of Constraints is tightly aligned to increasing capacity as its primary emphasis is on increasing throughput.
Lean Manufacturing is a collection of improvement techniques based on the idea that waste in all forms should be eliminated from the manufacturing process. There is a veritable laundry list of effective tools and techniques associated with Lean Manufacturing. Some of the most important are 5S, Andon, Autonomation, Continuous Flow, Error Proofing, Gemba, Just-In-Time, Kaizen, Kanban, Level Scheduling, Overall Equipment Effectiveness, Policy Deployment, Root Cause Analysis, Single-Minute Exchange of Die, Six Big Losses, Standardized Work, Takt Time, Total Productive Maintenance, Value Stream Mapping, and Visual Factory.
Two Strategies for Increasing Capacity in Manufacturing
Two highly effective strategies for uncovering and accessing the untapped potential that exists in your current factory are:
Measure Overall Equipment Effectiveness (OEE)
Problem: We need a consistent way of identifying Equipment Losses so we can reduce losses and increase capacity.
Strategy: Measure OEE (along with Availability, Performance, and Quality) and the Six Big Losses on your constraint equipment. Also capture reasons for down time.
Solution: XL automatically calculates a complete set of performance metrics both in real-time and historically:
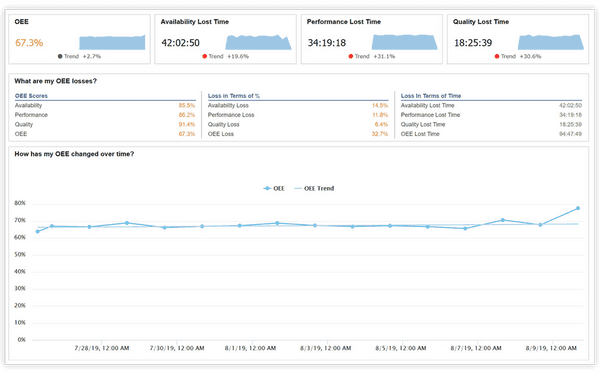
- OEE (including Availability, Performance, and Quality) for supervisors
- TAED (Target, Actual, Efficiency, Down Time) for plant floor operators
- Six Big Losses for characterizing Equipment Losses
XL also makes it easy to capture reasons for every down time event, which helps you prioritize your actions. Simply configure your down time reasons and XL automatically generates a barcode sheet for operators. Your operators scan barcodes to indicate reasons for each down time event and XL automatically “snaps” reasons to the most recent down time event. We recommend starting simple – no more than 25 reasons, one of which should be ‘All Other Losses’.

Measure Total Effective Equipment Performance (TEEP)
Problem: We need a consistent way of identifying how much room there is to increase capacity so we can decide whether to focus on getting more from our current equipment or if we need to consider other options (outsourcing production or purchasing new equipment).
Strategy: Measure TEEP and related metrics.
Solution: XL automatically calculates a complete set of TEEP-related metrics both in real-time and historically:
- TEEP
- Utilization
- Capacity Loss
- Capacity Lost Time
Use the built-in TEEP reports to identify how much additional production capacity is available.


