How to Reduce Manufacturing Costs

How Do You Reduce the Cost of Production?
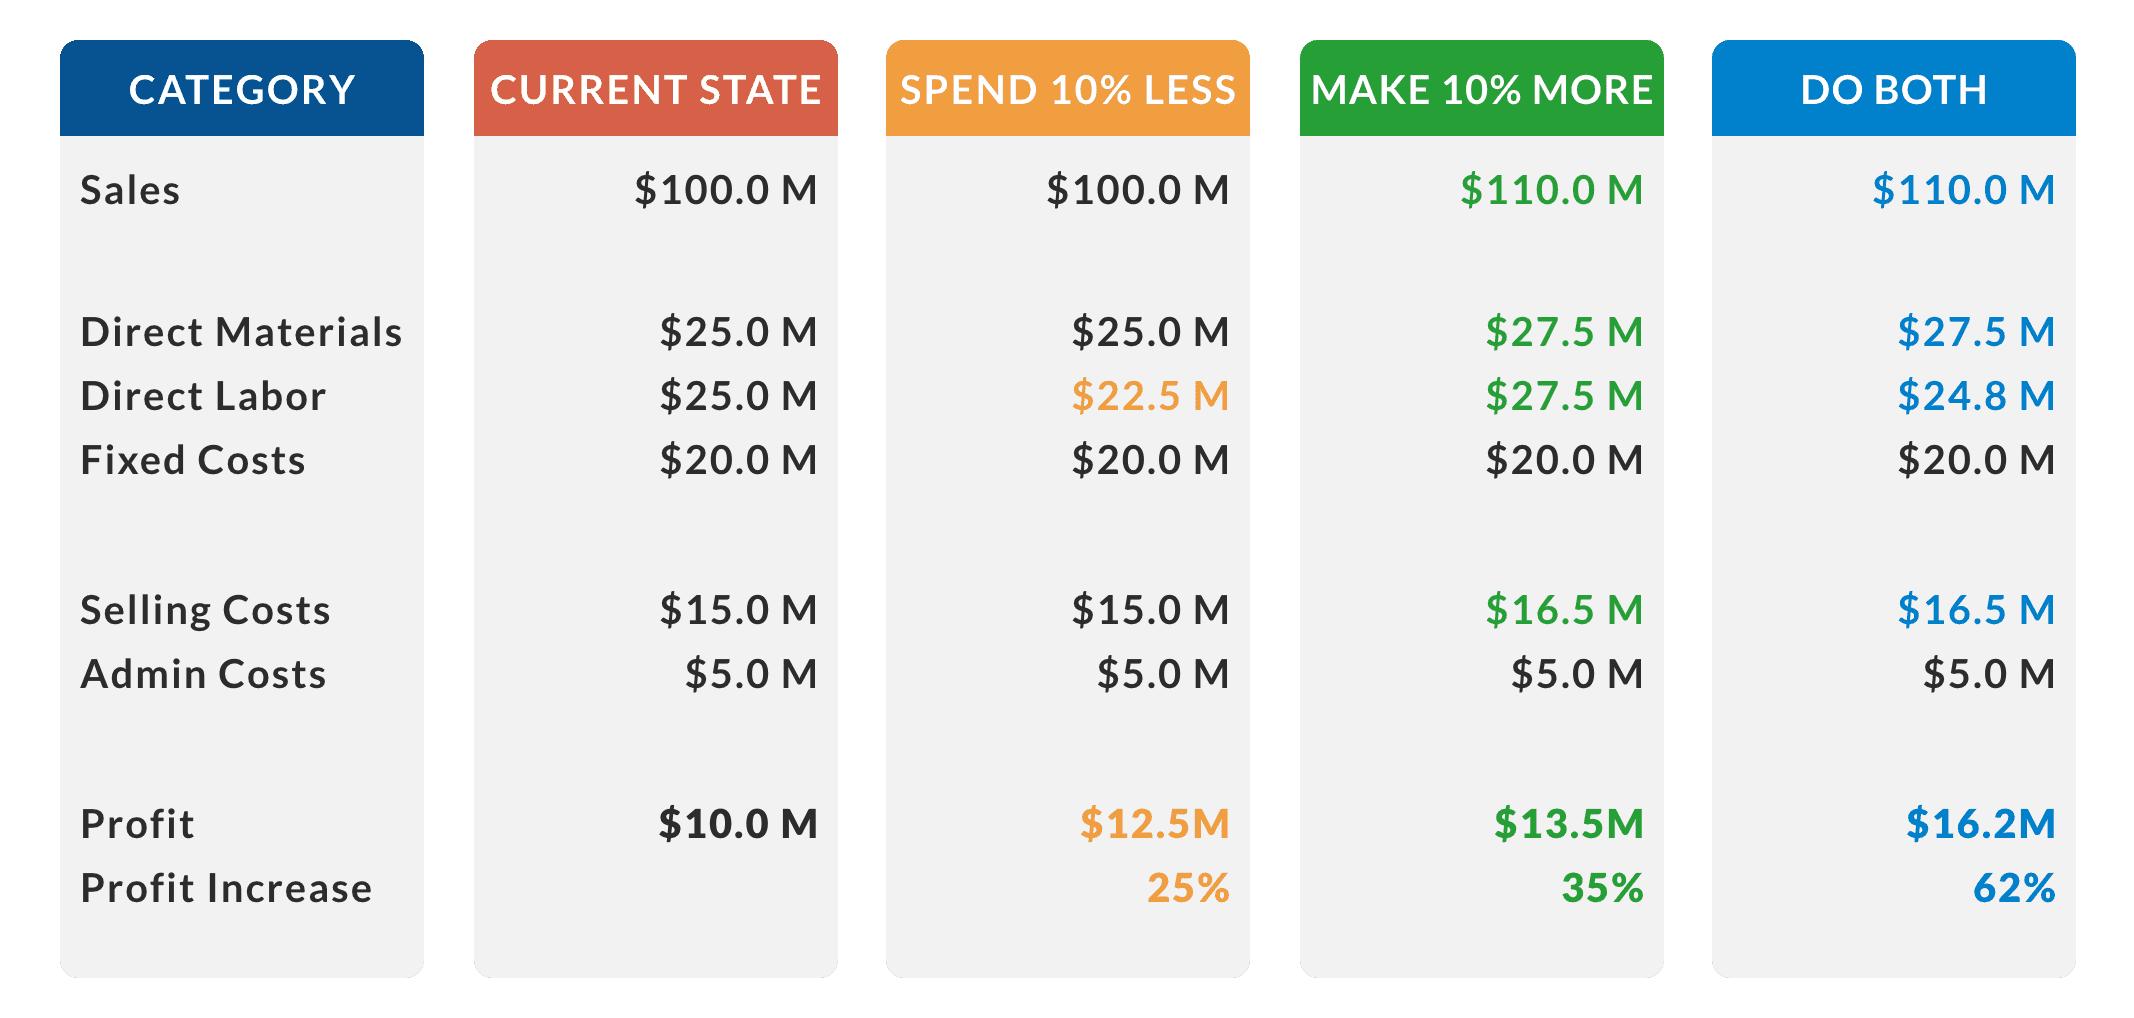
Reducing manufacturing costs can be achieved directly (by spending less) or indirectly (by making more):
- Spend Less: Manufacture the same number of parts using fewer resources
- Make More: Manufacture more parts using the same resources
Which is better? Both add value. Both are important. Neither is inherently “better”. However, companies often place more emphasis on cutting costs. The problem is, cutting costs (spending less) can quickly reach a point of diminishing returns, plus it has an absolute limit of zero, whereas increasing throughput (making more) has no such limit. Our recommendation – strive to achieve both.

Interestingly, two of the best-known improvement initiatives align very well to these two approaches to reducing cost (and increasing profitability):
- Lean Manufacturing: Spend less by relentlessly eliminating all forms of waste from the manufacturing process
- Theory of Constraints: Make more by relentlessly identifying and eliminating constraints on production; thus increasing throughput
There are many other disciplines and techniques for reducing manufacturing costs, such as Six Sigma, Design for Manufacturability (DFM), and Supply Chain Management (SCM). However, our primary focus will be on leveraging Lean Manufacturing (to spend less) and the Theory of Constraints (to make more).
Defining a Cost Savings Strategy
It is useful to define a formal strategy with ideas for reducing manufacturing costs. Once articulated, this strategy can then be consistently applied, both across equipment and over time. Here is an example definition:
We continually reduce our manufacturing costs by identifying the production constraint (the manufacturing bottleneck) and then applying all the tools and techniques at our disposal to improve the performance of the constraint. When it is no longer the constraint we identify the new constraint and repeat. Tools and techniques include proven best practices from Lean Manufacturing, Six Sigma, Theory of Constraints, and other sources. Non-constraint reductions in cost are also valued, but are a second priority to eliminating waste and increasing throughput at the constraint.
Best Practices for Reducing the Cost of Production
Theory of Constraints (TOC) identifies the most important limiting factor (referred to as the constraint) that stands in the way of achieving a goal (such as making a profit) and then systematically improves that constraint until it is no longer the limiting factor. In manufacturing processes the constraint is often referred to as a bottleneck. Interestingly, the constraint isn't necessarily equipment. It can also be policy (required or recommended ways of working), paradigm (deeply ingrained beliefs or habits), or even the marketplace (when production capacity exceeds sales).
The underlying power of TOC flows from its laser-like focus on a single goal (profit) and systematically removing impediments to achieving more of that goal (eliminating constraints). From the perspective of reducing costs, one of the most appealing characteristics of TOC is that it inherently prioritizes and focuses on improvement activities where they will have the greatest cost impact; the constraint.
Lean Manufacturing relentlessly eliminates waste (and thus cost) from manufacturing, where waste is defined as any activity that does not add value from the customer's perspective. From a plant floor perspective this waste is typically measured using OEE (Overall Equipment Effectiveness) and the Six Big Losses (Breakdowns, Setup and Adjustments, Reduced Speed, Small Stops, Startup Rejects, and Production Rejects). Lean Manufacturing provides a direct path to reducing costs by providing a broad range of tools and countermeasures to improve OEE and reduce the Six Big Losses.
Causal Loss provides detailed and insightful information about losses that occur at the constraint by separating them into two categories:
- Internal Loss: A loss that occurs because of a condition that is internal to the constraint
- External Loss: A loss that occurs because of a condition that is external to the constraint
In the case of External Loss, it is important to identify both the causal step of the manufacturing process and the underlying reason for the loss. The end result is a much more complete picture of loss at the constraint (improved information), a much better ability to focus on the losses that really matter (losses at the constraint), and a much better ability to take action to eliminate those losses (improve throughput of the constraint). It is a manufacturing best practice to track three types of External Loss:
| Loss Type | Description |
|---|---|
| Starved | The constraint stops or runs slowly because of an upstream issue that results in a lack of raw materials on the process infeed. |
| Blocked | The constraint stops or runs slowly because of a downstream issue that results in a buildup of finished materials on the process outfeed. |
| Downstream Quality | The constraint needs to produce additional parts to replace parts lost to downstream quality issues. |
Lean Manufacturing improvement initiatives can be tightly focused; however, more typically they are implemented as broad-spectrum initiatives (i.e., across all equipment). Theory of Constraints on the other hand has a laser-like focus on improving the constraint. Combining the two together (with Causal Loss providing a complete picture of losses at the constraint) creates a terrific opportunity to significantly reduce costs and improve profitability.
Three Great Strategies to Reduce Manufacturing Costs
Three effective strategies for reducing manufacturing costs are:
1. Attack Your Top Losses
Problem: We want a simple and effective way to reduce manufacturing costs; one that can be applied to all equipment in our plant (i.e., we want to spend less).
Strategy: Focus on addressing the top sources of lost production time with a secondary focus on emergent problems (losses that are trending higher).
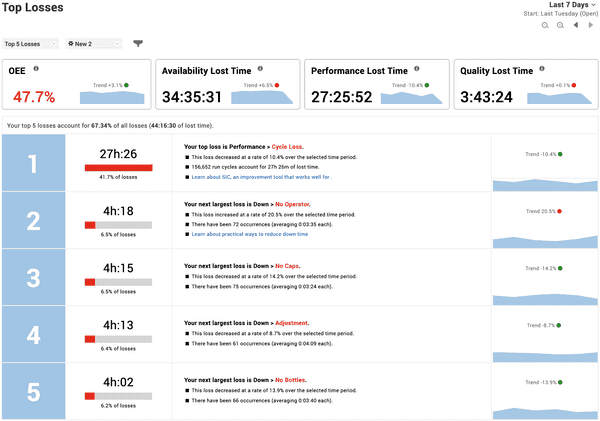
Solution: The XL Top Losses report provides extensive information about your largest sources of lost production time, including trend information and sparklines that are particularly useful for spotting emergent problems. To decide where to focus your time and attention simply:
- Set the Date Range to Last 30 Days.
- Identify one loss within the top five that the team feels most confident they can improve.
- Agree on an improvement target and any external resources needed to reach that target.
Review progress by continuing to monitor the Top Losses report (especially trend information).

2. Improve the Constraint
Problem: We want to increase throughput of our manufacturing process (i.e., we want to make more).
Strategy: Apply Causal Loss to get a complete picture of all losses at the constraint. Use reason codes to distinguish between Internal Loss and External Loss. For each External Loss identify both the causal step and the underlying loss reason.
Solution: XL provides many analytics tools that leverage reason code information. Capturing reasons is especially easy when all operators have to do is scan an appropriate barcode. XL makes this even easier by automatically generating barcode sheets for your operators and automatically “snapping” reasons to the most recent matching event.
Use XL to capture four types of reason codes:
- Internal: The constraint stops or runs slowly because of an issue internal to the constraint
- Starved: The constraint stops or runs slowly because of an upstream issue
- Blocked: The constraint stops or runs slowly because of a downstream issue
- Downstream Quality: The constraint will need to replace parts lost to downstream quality issues

3. Win the Shift
Problem: We want to proactively engage plant floor employees so they can help us reduce costs.
Strategy: Focus attention on the constraint (or other critical equipment) with a scoreboard that encourages employees to “win their shift” by meeting or exceeding throughput targets.
Solution: XL includes an integrated scoreboard with over 100 built-in metrics. One of the most effective sets of metrics for the plant floor is TAED, which instantly identifies whether production is ahead or behind the production target – in real-time:
- Target: Quantity of good parts that should have been manufactured
- Actual: Quantity of good parts actually manufactured
- Efficiency: Ratio of Actual to Target; an Efficiency score of 100% or better means your team is winning their shift
- Downtime: Calling real-time attention to one of the biggest “disruptors” of production
When the team meets or exceeds expectations, XL can automatically display a message that reinforces their achievement.


