Reduce and Avoid Machine Downtime

What Is Machine Downtime?
Machine downtime is time accumulated when your manufacturing process is stopped for an unplanned event (e.g., a motor failure). While downtime is most often associated with equipment failures (breakdowns), it actually encompasses any unplanned event that causes your manufacturing process to stop. For example, downtime can be triggered by material issues, a shortage of operators, or unscheduled maintenance. The unifying element is that although production is scheduled, the process is not running due to an unplanned stop.
What Is a Planned Stop?
By way of contrast, a planned stop is any event where the process is unavailable to run due to a preplanned activity, such as a changeover or scheduled maintenance.
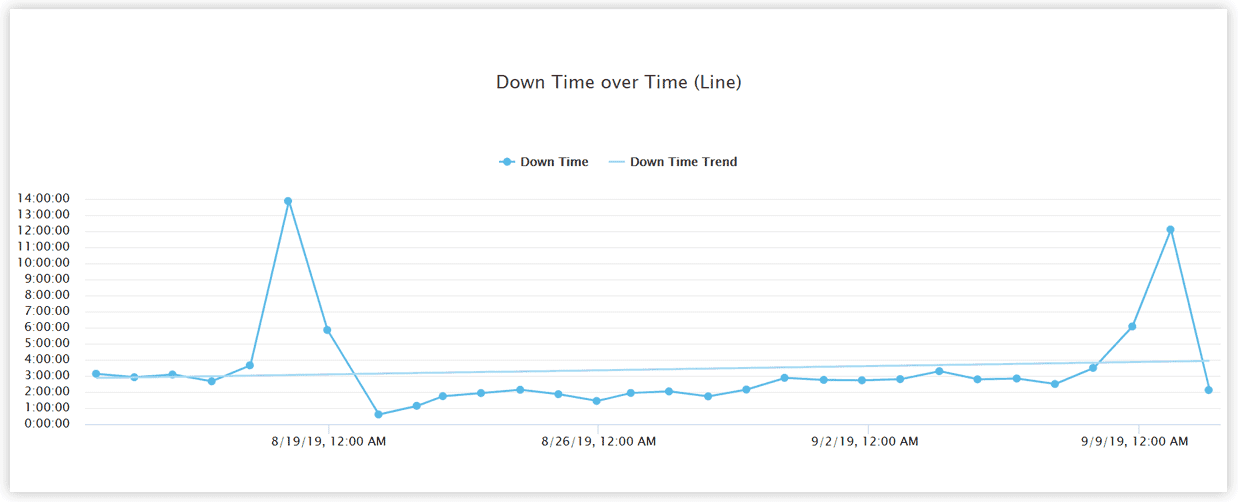
How to Measure Downtime
In order to measure downtime accurately, it is important to create a clearly defined standard and then consistently apply that standard (over time and across equipment). It is particularly important to define the difference between downtime (an OEE Availability Loss) and small stops (an OEE Performance Loss). A good way to do this is to define a time-based threshold that differentiates between downtime and small stops, based on the idea that a reason should be captured for every downtime event, whereas it is not expected to capture a reason for every small stop (e.g. obstructed flow, jam, misfeed, sensor blocked, cleaning, checking). This time-based threshold can be based on absolute time or relative time.
How to Calculate Downtime
For downtime, we recommend the following simple definition based on absolute time:
Downtime events are unplanned stops that are long enough that we assign a reason for each occurrence. In practice, we define downtime as any unplanned stop that is five minutes or longer.
An alternative definition, based on relative time, integrates Ideal Cycle Time (the theoretical minimum time to produce one piece) into the definition. For example:
Downtime events are unplanned stops that last for more than 100 manufacturing cycles (i.e., are 100 times longer than the Ideal Cycle Time).
Effects of Downtime on Manufacturing Productivity
For most manufacturers, downtime is the single largest source of lost production time. It receives a high level of attention since equipment failures and breakdowns are highly visible (nothing is more frustrating than watching manufacturing equipment standing idle). As visible as downtime is, an amazing number of companies significantly underestimate their true downtime – especially when they estimate their downtime or manually record downtimes for each occurrence. Fortunately, this is an easy problem to fix (through simple automation as described later).
If your manufacturing process includes multiple pieces of equipment (such as in a packaging line) it is very important to focus attention on the constraint of the process. In particular, focus on downtime:
- At the constraint itself (e.g., in a bottling line the constraint is often the filler)
- At upstream equipment that goes down and starves the constraint
- At downstream equipment that goes down and blocks the constraint
Focusing improvement efforts on the constraint ensures optimal use of resources and is the most direct route to improved productivity and profitability.
From the perspective of Overall Equipment Effectiveness (OEE) and Total Equipment Effectiveness (TEEP), downtime is captured as an Availability Loss. From the perspective of the Six Big Losses, downtime is captured as an Unplanned Stop.
Best Practices for Avoiding and Reducing Downtime in Manufacturing
The ultimate best practice for avoiding and reducing downtime is Total Productive Maintenance (TPM). TPM emphasizes proactive and preventative maintenance to maximize the operational efficiency of equipment. It blurs the distinction between the roles of production and maintenance by placing a strong emphasis on empowering operators to maintain their equipment. TPM has many elements: 5S, Autonomous Maintenance, Planned Maintenance, Quality Integration, Focused Improvement, New Equipment Management, Training, Education, Safety, and more. In fact, both OEE and the Six Big Losses are originally from the world of TPM.
Implementing TPM is a substantial task that involves high levels of support from executive levels of an organization. If you don't currently have the resources to commit to a TPM program, here are four proven best practices that are very effective as quick wins for reducing downtime.
How to Reduce Machine Downtime
Four highly effective strategies for reducing downtime are:
- Automate Downtime Tracking for Accuracy
- Categorize Downtime with Reasons
- Expose Downtime in Real Time
- Attack the Largest Sources of Downtime First
1. Automate Downtime Tracking for Accuracy
Problem: We are not sure if our downtime numbers are accurate. As a result, when we're reviewing our losses we don't know if we're working on the right things.
Strategy: Replace manual tracking of downtime with automated tracking of downtime (track downtime based on equipment inputs rather than operator tick sheets).
Solution: XL automatically detects downtime using a single input from your equipment (usually an existing sensor that counts parts or equipment cycles). XL records every downtime event with sub-second accuracy. The XL scoreboard shows downtime in real-time on the plant floor and XL provides downtime information to employees everywhere using patented technology and its integrated web server.
2. Categorize Downtime with Reasons
Problem: We are having trouble prioritizing improvement actions because we don't have good enough information about why our equipment isn't running.
Strategy: Capture reasons for each downtime event.
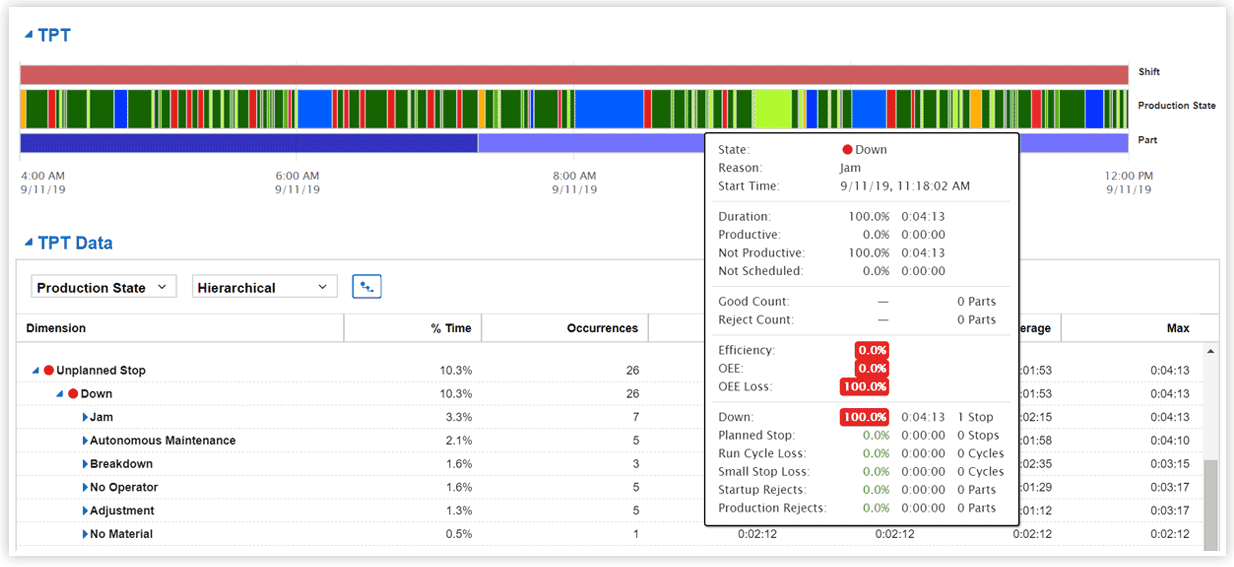
Solution: It is essential to capture a reason for every downtime event to help you prioritize actions. XL makes this very easy – simply type in your downtime reasons and XL automatically generates a barcode sheet. Your operators scan barcodes to indicate reasons for each downtime event and XL automatically “snaps” reasons to the appropriate downtime event. We recommend starting simple – no more than 25 reasons, one of which should be ‘All Other Losses’.
As a best practice, make sure that every reason is clear (when looked at in the context of other reasons) and describes a symptom (as opposed to attempting to diagnose a root cause). Remove reasons that are rarely used and add reasons as needed to ensure that ‘All Other Losses’ is not in the top ten losses.
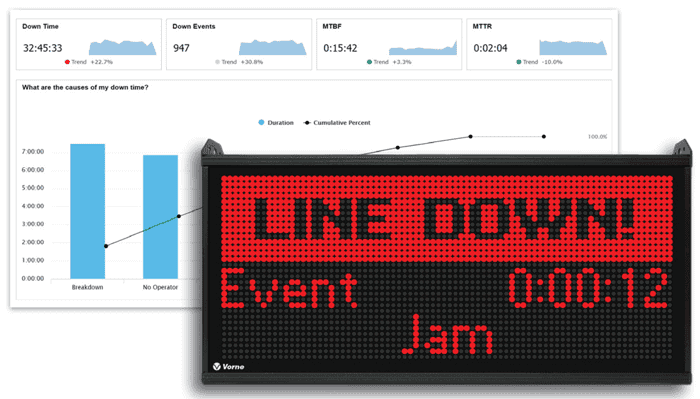
3. Expose Downtime in Real Time
Problem: We have multiple manufacturing lines, so it's hard for us to know where to focus our attention. We have reports about what happened in the past but we want to know where our biggest problems are right now – so we can fix them before they affect our numbers for this month.
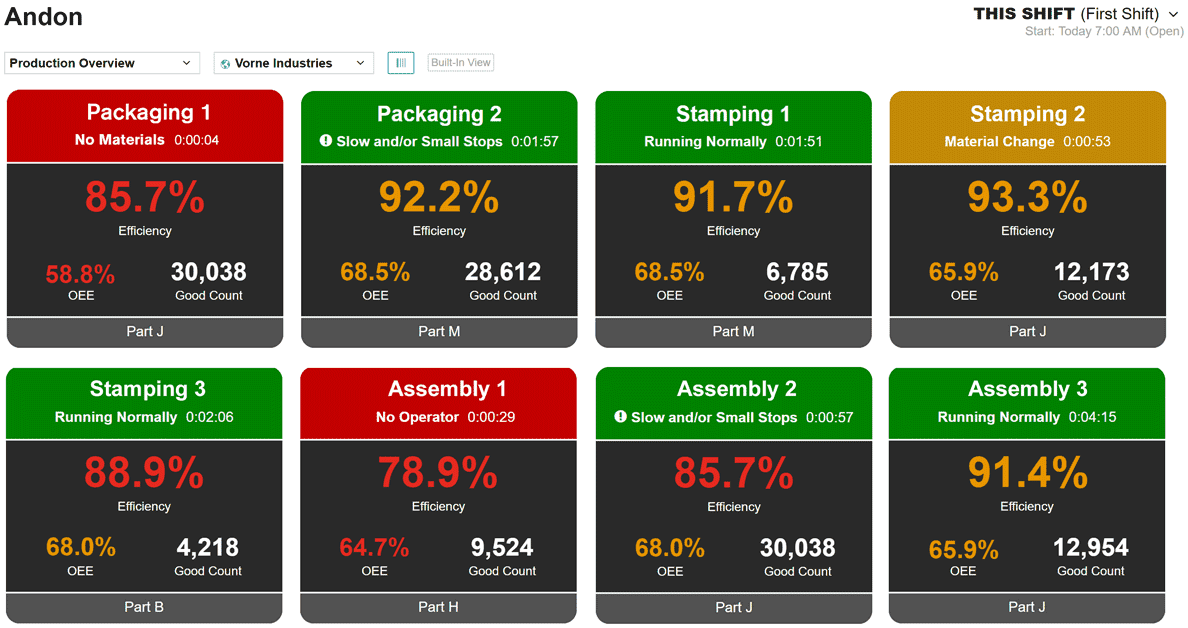
Strategy: Create a dashboard that shows you the instantaneous “right-now” status of your entire plant (including which lines are down).
Solution: XL tracks the current state of every monitored production asset. Any combination of real-time metrics can be shown to give you whatever context you need for effective decision-making. Information can be viewed hierarchically (e.g., by department), and color is used to show the real-time “right now” status of each production asset.
4. Attack the Largest Sources of Downtime First
Problem: Now that we are accurately tracking our downtime (with reasons), we want a simple but systematic approach to reducing downtime.
Strategy: Use top loss information to systematically attack your largest sources of downtime.
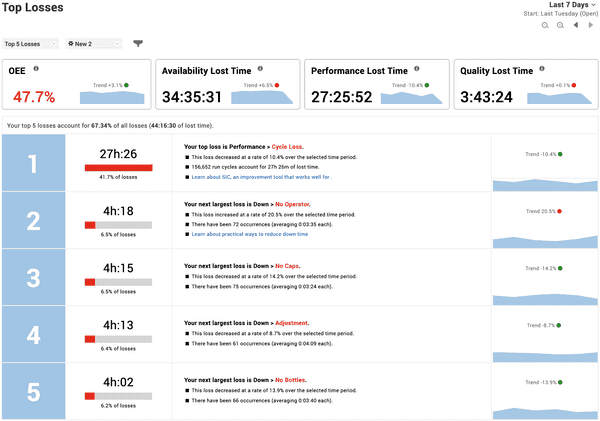
Solution: XL provides rich reporting and strong insights about where you are losing the most productivity. Use the Top Losses report to identify which downtime reason to attack next. Here's how:
- Set the Date Range to Last 30 Days.
- Set the View to the appropriate shift.
- Identify one loss within the top five that the team feels confident they can improve.
- Agree on an improvement target and any external resources needed to reach that target.
Post the report in the area. Review progress by monitoring Top Losses information.
