Production Monitoring Software

Reporting System or Continuous Improvement Platform?
Production monitoring software enables you to make informed decisions and take effective actions to improve your manufacturing operations. As a software solution, it is easy to think of it primarily as a reporting platform. However, as we will explore in this article, its deeper and more important value is as a continuous improvement framework.
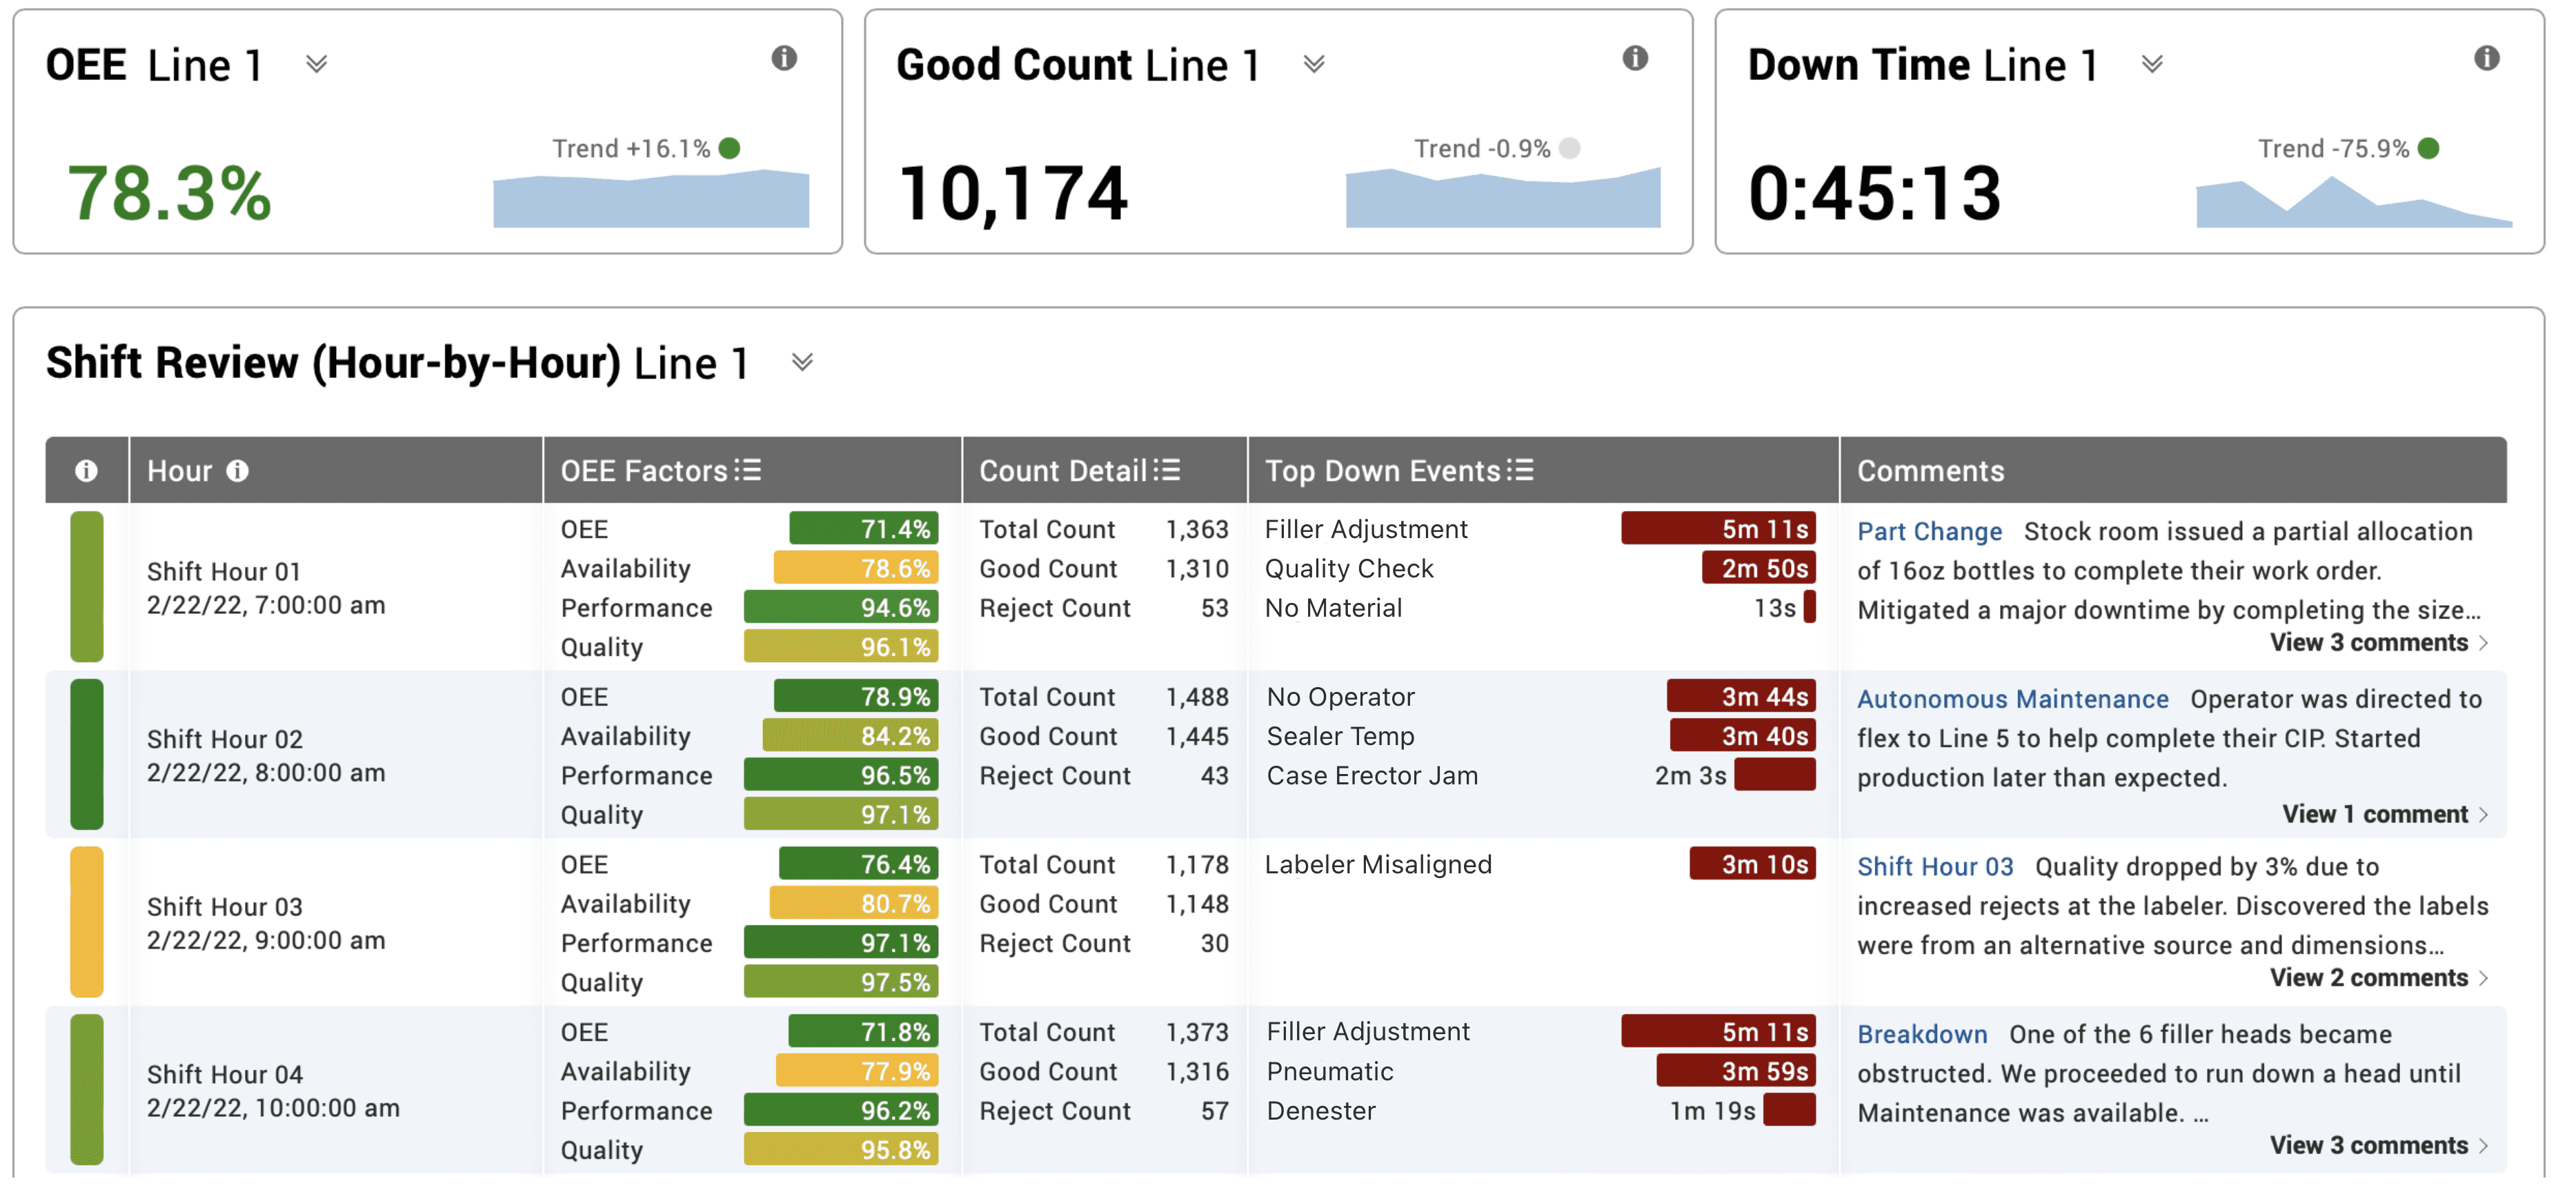
Information from production monitoring software can be as broad as an all-encompassing Shift Review (shown below) or as focused as an OEE Deep Dive (discussed later).
Many companies, even today, continue to use spreadsheets, whiteboards, and home grown systems to collect production data. There is no reason to do so anymore. Advances in IIoT and edge computing make it easier than ever to implement a very cost effective production monitoring system that provides deep insights into your manufacturing operations.
Most companies are very surprised to learn that they can build an enormously rich data foundation from just two or three sensors. In fact, all the reports shown in this article can be generated from just three sensors: In, Cycle, and Out.
Not ready to take the leap? No problem. You will still learn a lot of valuable techniques by reading further!
Five Production Tracking Software Report Examples
Here are five examples of insightful and actionable reports that can be easily generated with production tracking software.
Usually, you will achieve the best results using a mix of built-in reports and custom reports:
- Built-in reports provide immediate insights through the lens of best practices
- Custom reports provide the exact information you want, formatted the exact way you want it, to best support your continuous improvement projects
Either way - the goal is to give you the information you need to confidently and rapidly improve production.
All Production
The name says it all. This report shows you data for every work center and rolls it up across area and site through to your entire enterprise. It is your production tracking gold standard, providing one page from which you can monitor your entire plant (or enterprise). For example:
- Quickly check if all your lines are operating as expected
- View production from different perspectives, such as Production Overview, OEE Factors, Six Big Losses, Hidden Factory and Cycle Time Audit
- Instantly change your focus from operational (current hour) to tactical (this week) to strategic (this quarter)
- Create your own views with whatever metrics matter most to you and your team
- Quickly compare metrics across similar work centers within a site or area
- Identify and analyze consistently underperforming work centers
To summarize, the All Production report enables you to see all your manufacturing processes in one place, hierarchically roll up data from work center to enterprise, and explore data from many different perspectives.
OEE Deep Dive
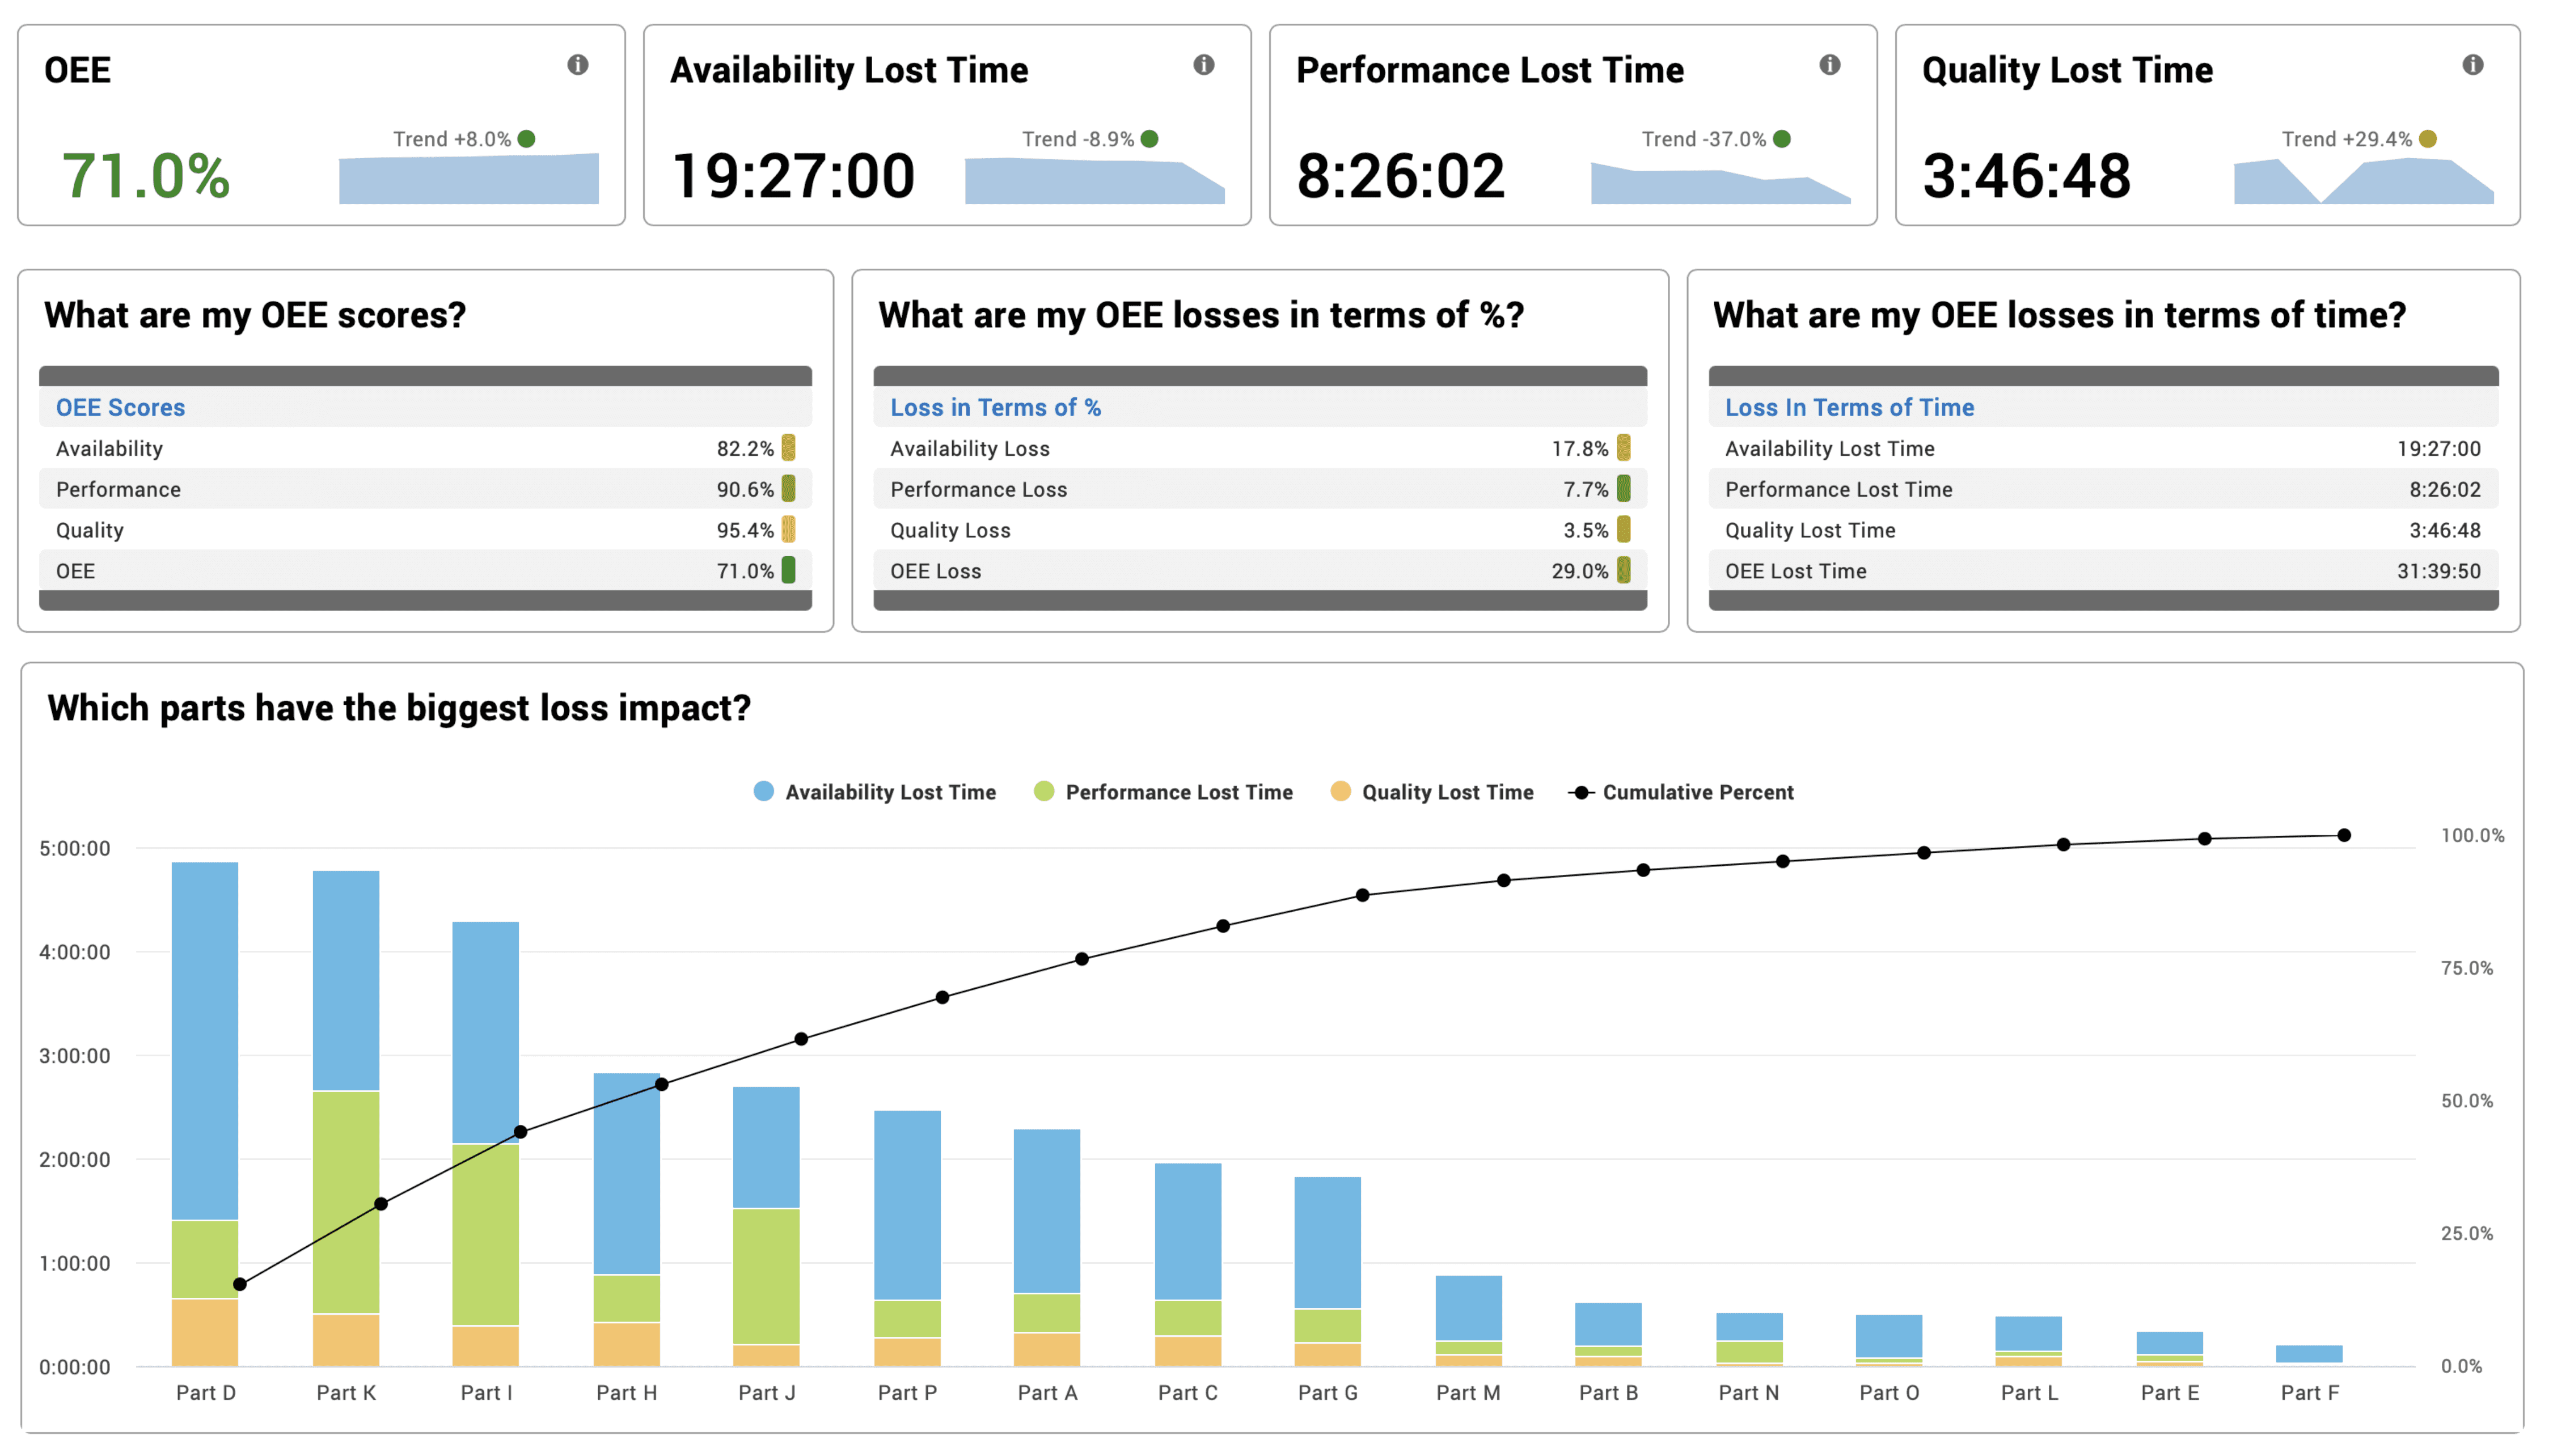
OEE (Overall Equipment Effectiveness) continues to be the single most important metric for measuring manufacturing productivity. Every manufacturing operation should know their OEE score. However, when viewed through the lens of continuous improvement, the most important OEE metrics present OEE in terms of loss - such as Availability Lost Time. Focusing on OEE from a loss perspective transforms OEE from a benchmark into a family of actionable improvement metrics - even more so when expanded to the Six Big Losses.
For example, consider a Pareto chart of parts that stacks OEE losses in units of time to show which parts have the biggest loss impact (as shown below). This report is interesting because it is purposefully not based on normalized data - if a part is run more frequently, it will have more impact on losses, and it will present a larger opportunity to reclaim production time. This is an example of transforming an OEE software solution into a continuous improvement tool.
To summarize, the OEE Deep Dive report analyzes OEE from a loss perspective, providing you with many different ways to explore OEE losses, so you can focus your improvement actions on wherever they will have the greatest impact.
Downtime Analytics
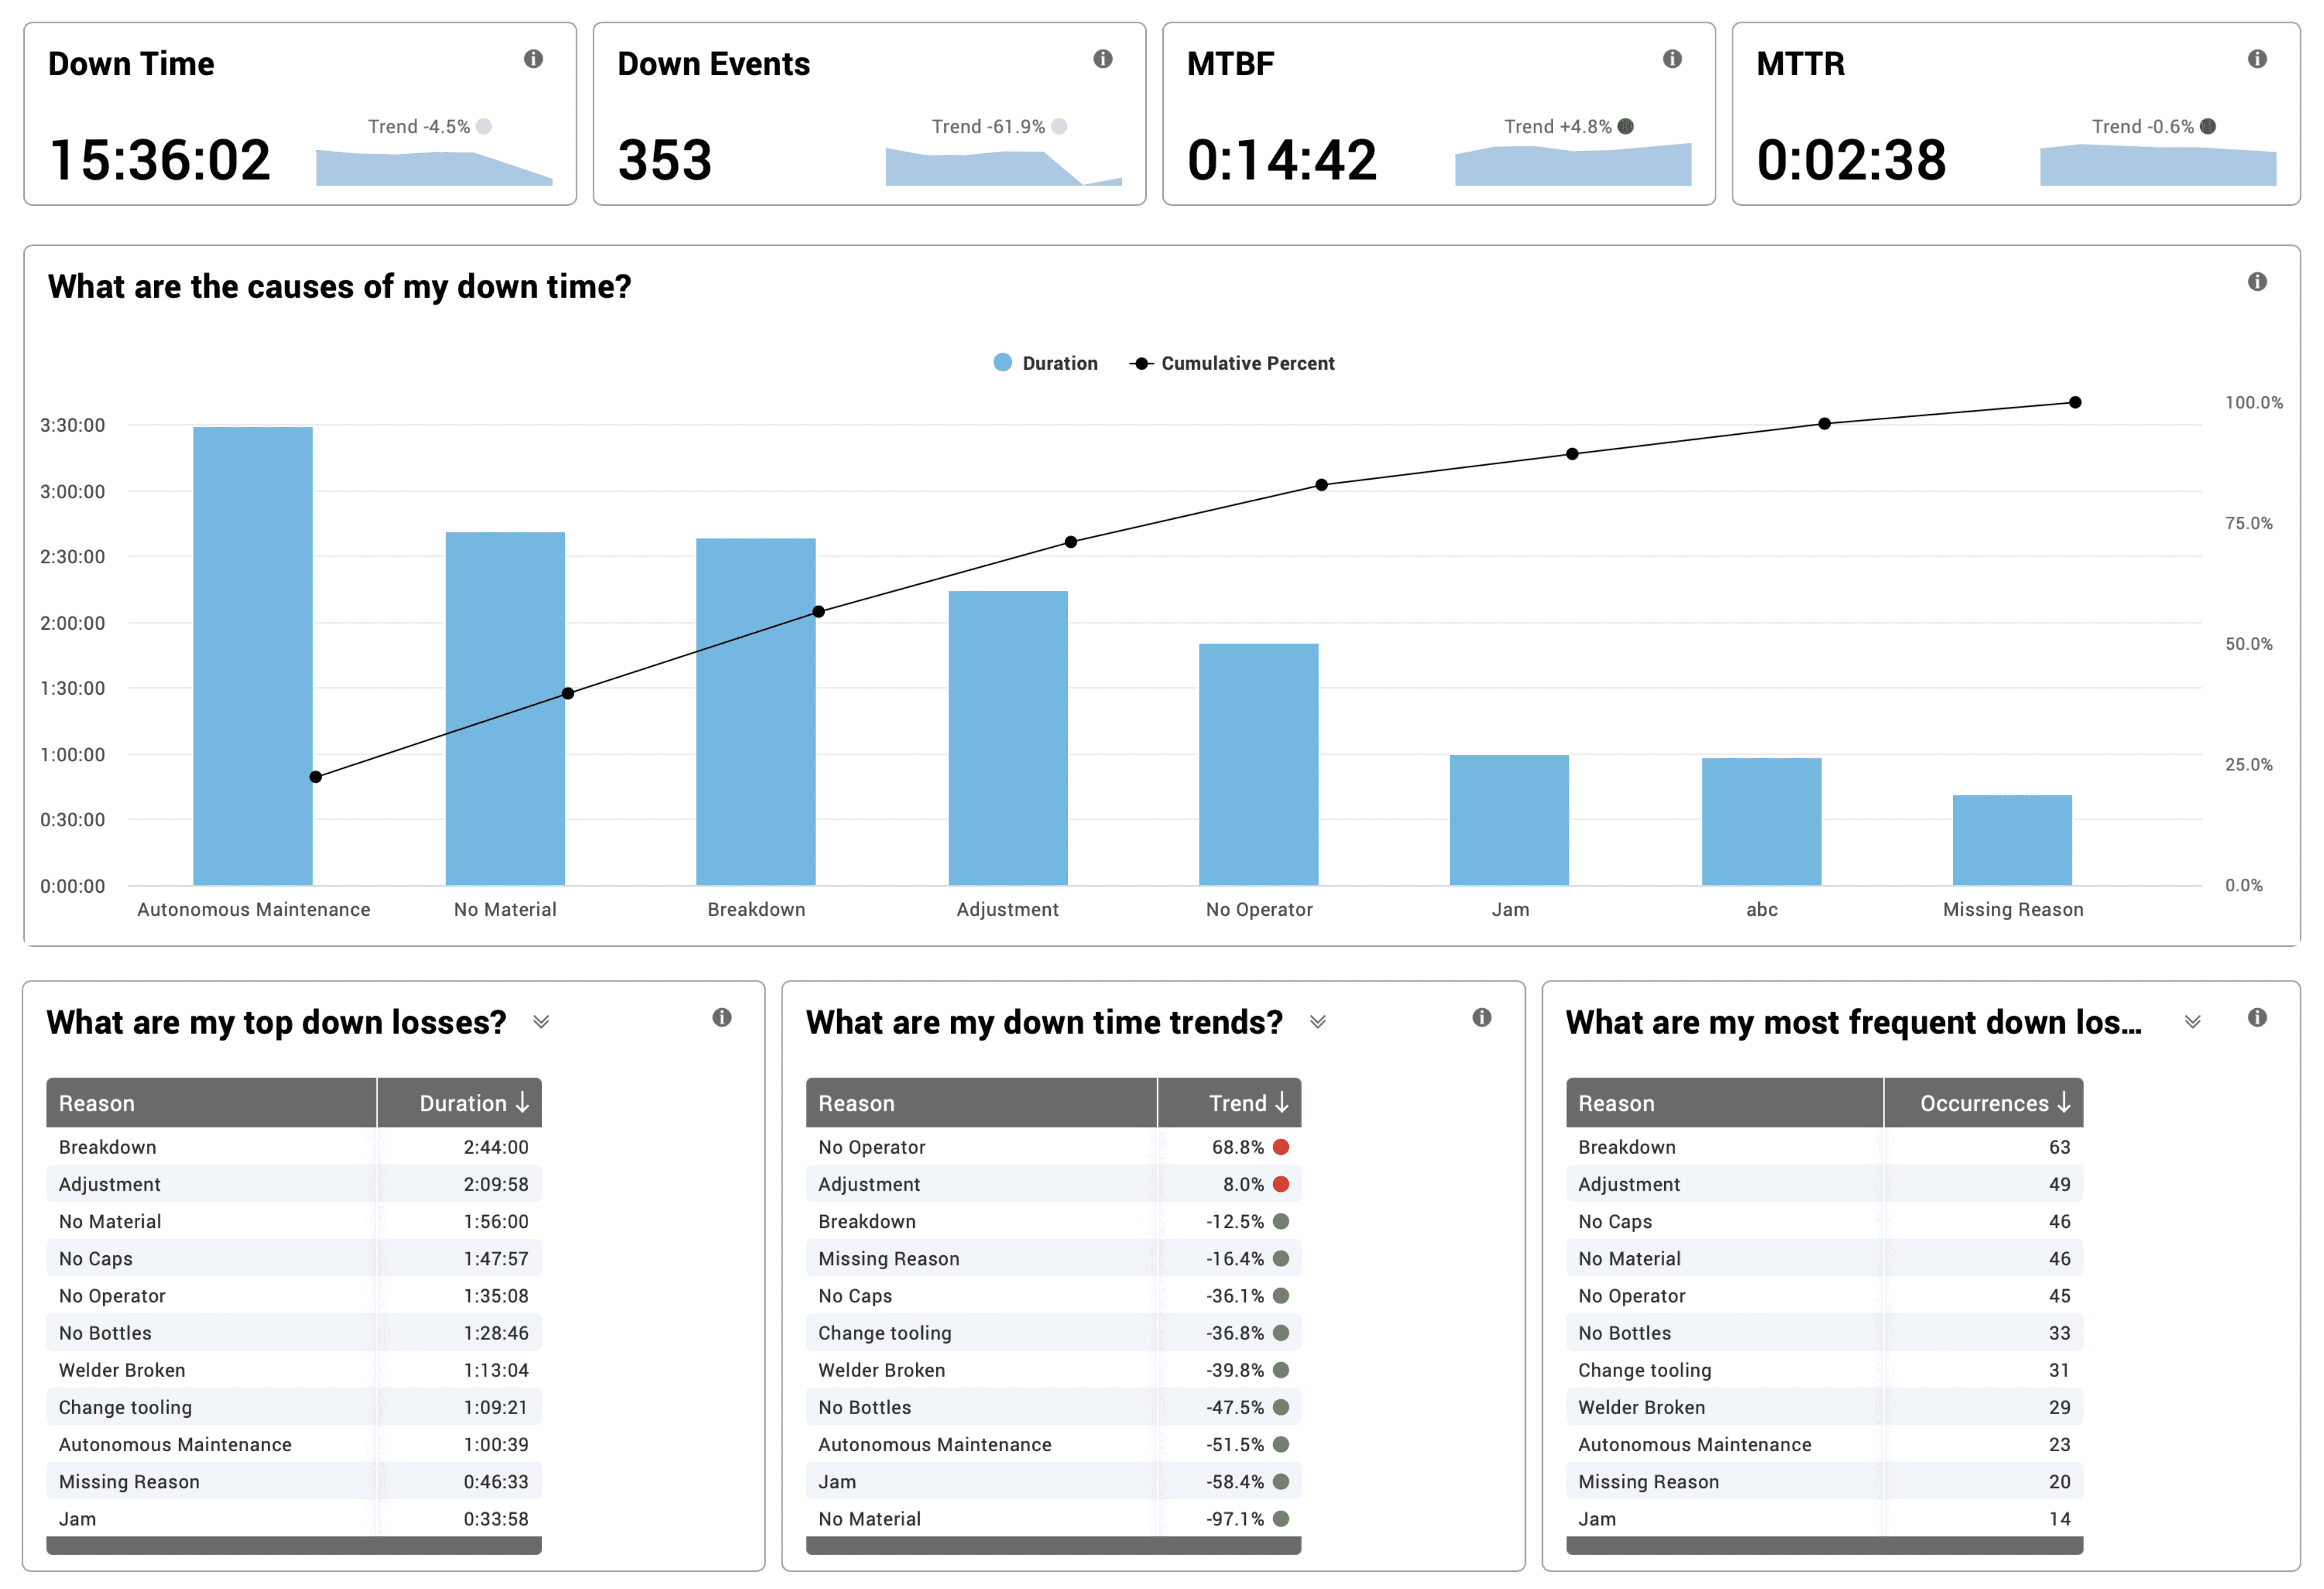
Downtime is the largest source of lost production time for the overwhelming majority of manufacturers. Your production monitoring system should track downtime in real time (empowering operators to take immediate action) AND present downtime with historical context (empowering managers to make data driven decisions). In other words:
- Get your lines back up and running as quickly as possible (short-term improvements)
- Identify troublesome patterns that can be mitigated to prevent downtime in the first place (long-term improvements)
Here are several examples of how the Downtime Analytics report can help you:
- Know your largest sources of downtime - and select the next one to mitigate
- Detect emerging sources of downtime - and quickly address them before they become larger problems
- Identify particularly problematic parts or part runs - and correlate their sources of downtime
- Review differences between shifts - and treat them as opportunities to capture and transfer knowledge across teams
Continuously improve. One downtime issue at a time.
To summarize, the Downtime Analytics report reveals your largest sources of downtime and correlates them with causes in ways that make it easier to understand and mitigate them.
Total Production Timeline
The Total Production Timeline™ (TPT) report is particularly useful for analyzing shorter time periods, such as individual shifts and part runs. By time-aligning different dimensions of data (e.g., Part, Shift, Hour, and Production State, as shown below) you can simultaneously explore that data from two analytical perspectives:
- Sequential (over time)
- Parallel (across data dimensions)
Different color models provide different types of insights. For example:
- Heat Map Colors: A continuous color gradient provides an instant visual of Efficiency, Downtime, your OEE score, or other metrics (green is good, amber is marginal, red is bad)
- State Colors: Fixed colors associated with production state provide an instant visual of the state of the manufacturing process (green is run, amber is changeover, red is down, blue is break)
Taken together, these analytical perspectives and color models provide a visual palette from which it is much easier to identify patterns, trends, and problem areas.
To summarize, the Total Production Timeline report makes it easy to visually explore data and see information in a way that makes it much easier to make connections between cause and effect.
Andon
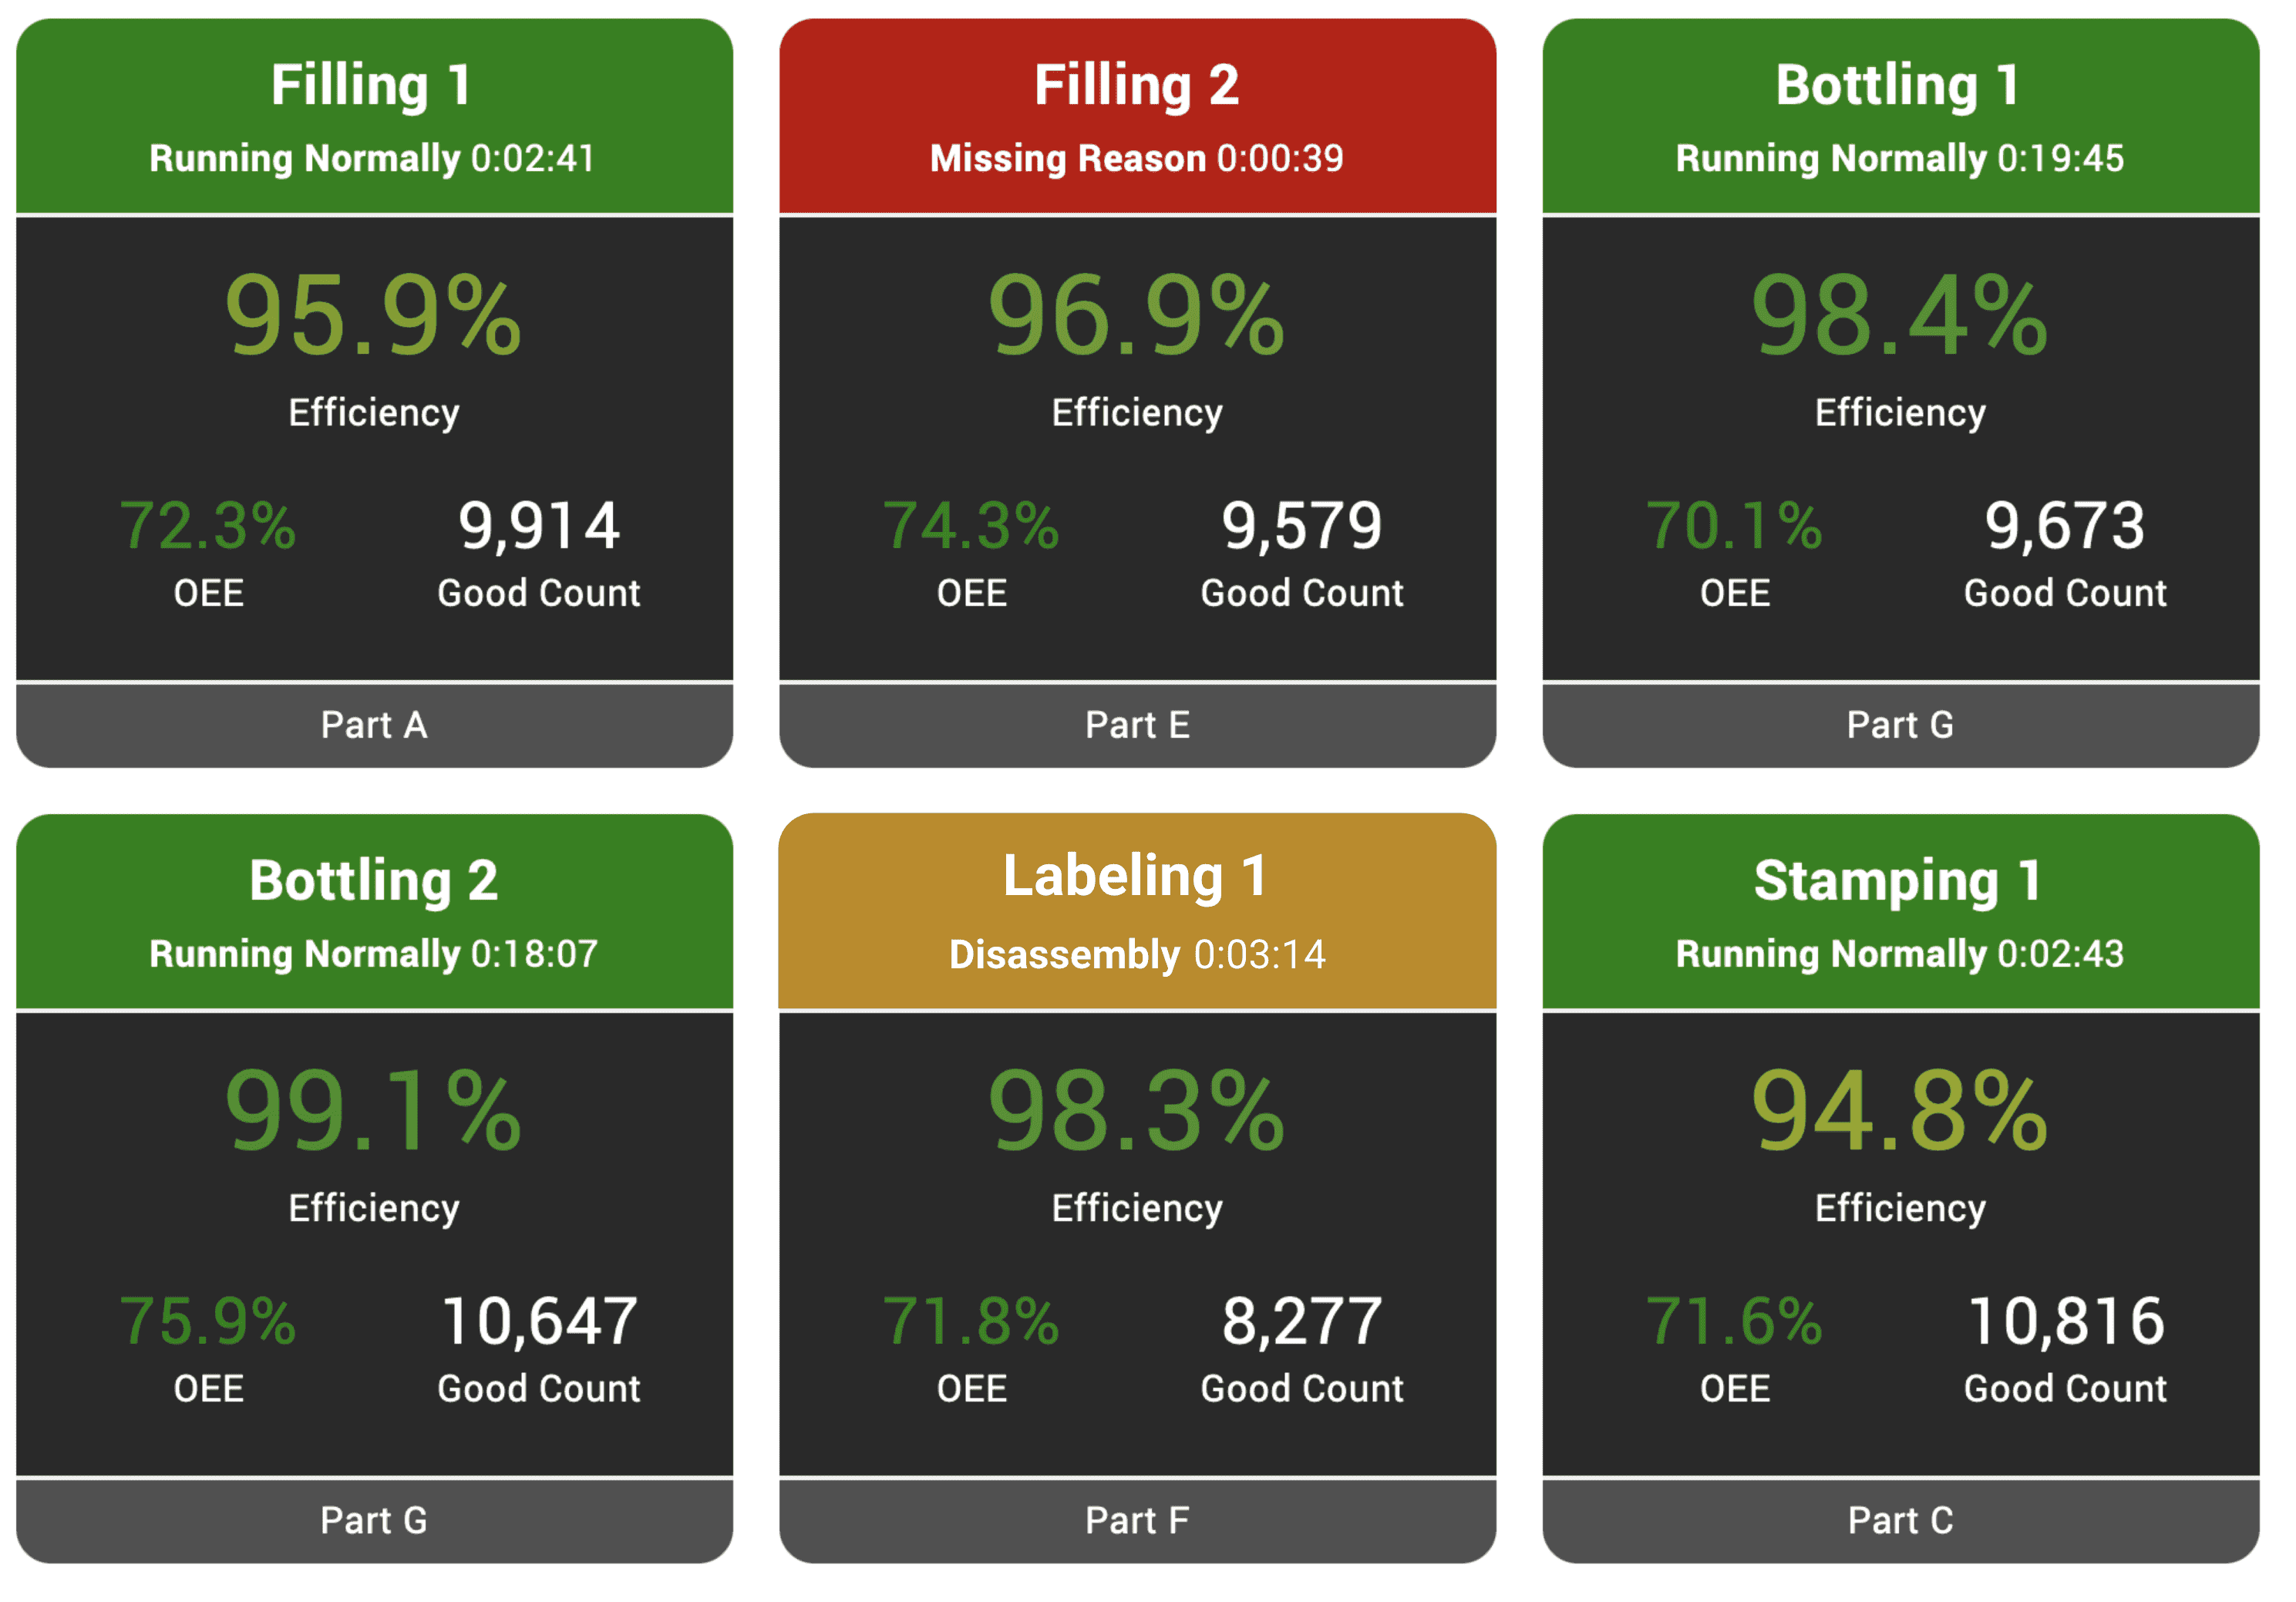
Andons are a fundamental element of traditional lean manufacturing and continuous improvement programs. We discuss them in depth in our article about Andons, but here is a quick summary:
The concept of the Andon can also be applied to production monitoring software solutions. Andons are a great way to view the current state of your production lines. They enable you to easily scan a page and instantly see where attention is needed. Color tells a story, and carefully curated data dimensions and metrics, that you choose, enrich that story.
To summarize, the Andon report visually represents the real-time status of every process in a way that enables you to quickly identify areas of concern.
Custom Reporting
Invariably, there is great excitement when you transition from whiteboards and spreadsheets to a production monitoring system that provides you with so much more information and actionable intelligence. Equally invariably, there will reach a point where you say, “But, I want to see….” This is why custom reports are a critical part of production tracking software.
Every manufacturer has unique needs, and the ability to create reports that capture exactly the information you want, exactly how you want to see it, will quickly become a critical requirement. For example, when executing a continuous improvement project, custom reports enable you to curate the perfect, one-stop dashboard with which to gain insights and measure progress.
Dashboards
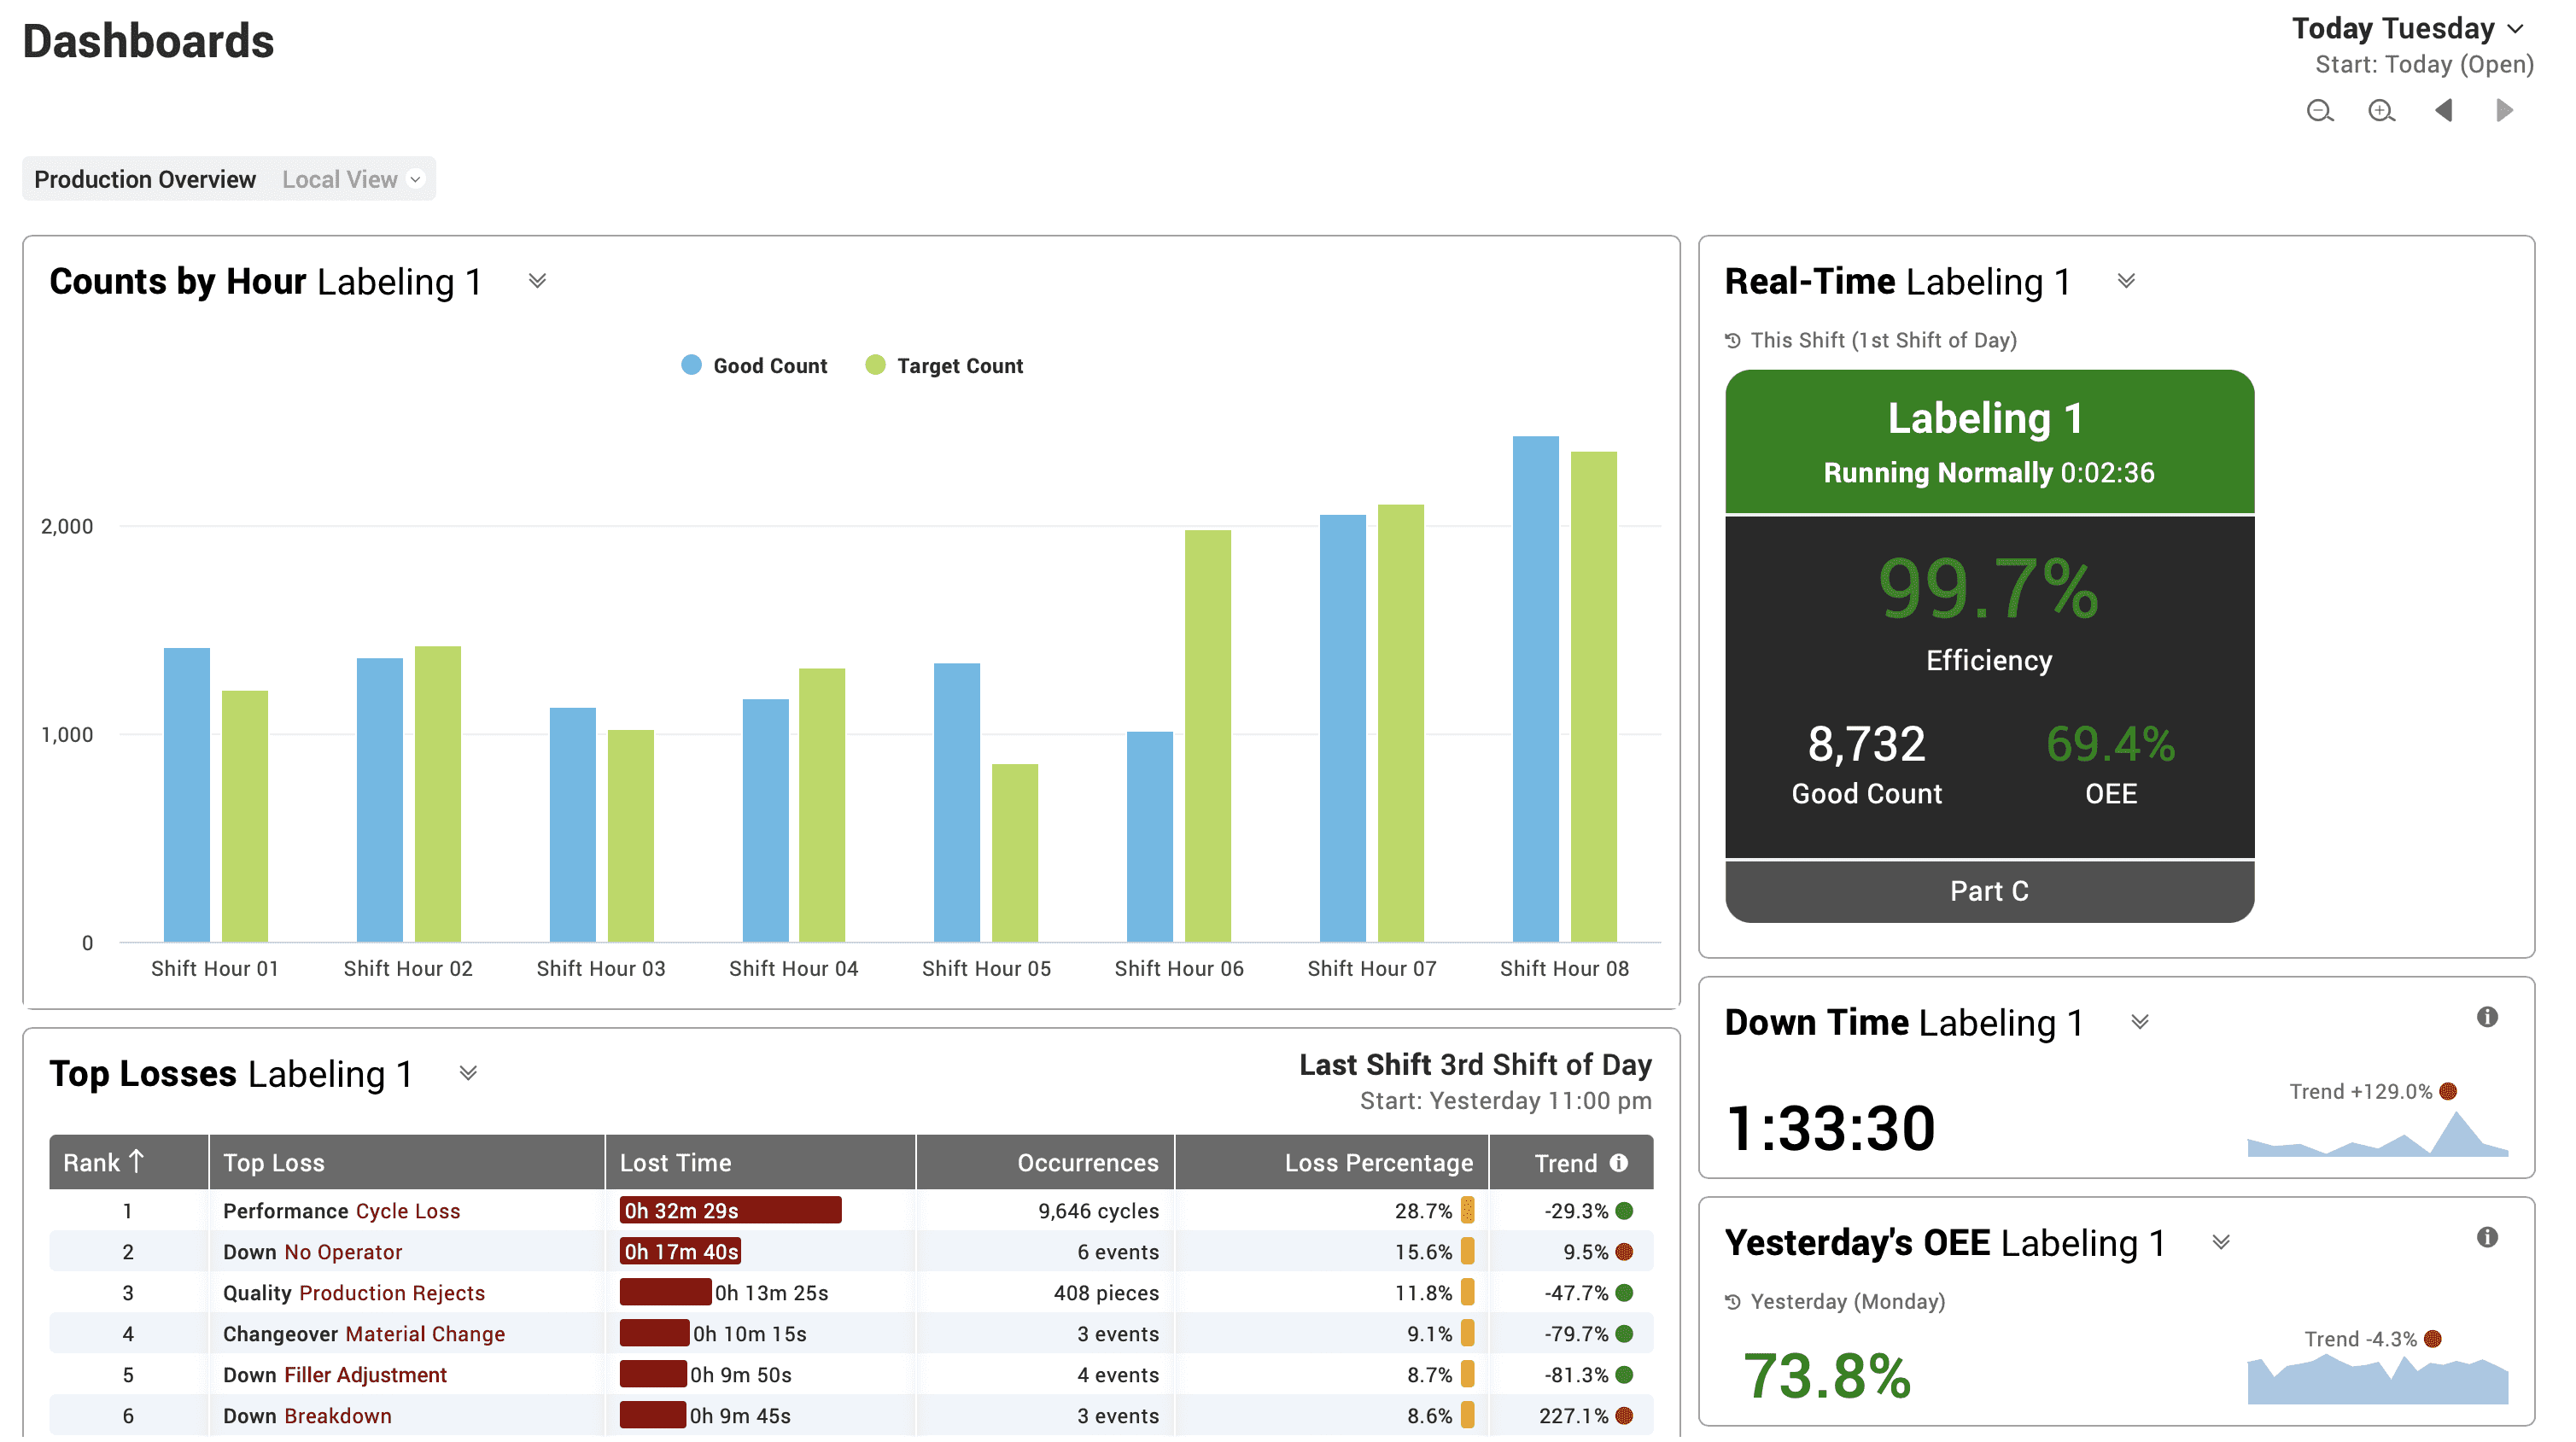
If a built-in report does not meet your needs - there is a simple solution. Configure your very own custom dashboard. Create as many dashboards as you would like, choosing widgets, data dimensions, and metrics to tell your own story. Save it. Share it. See exactly the information you need. No more and no less. Take control and create your ideal production tracking dashboard.
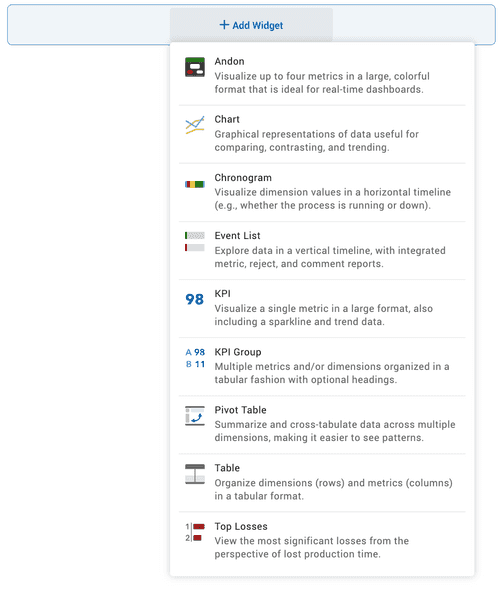
Widgets provide you with the visual elements of your dashboard, each widget highlighting information in its own unique way.
Dimensions and metrics provide you with the data elements of your dashboard, defining the set of production data that will be featured for each widget.
If deep in your heart, you always wanted to combine a Counts by Hour chart, a Real-Time andon, a Top Losses table, and Down Time and Yesterday’s OEE KPIs in one place - who are we to say no!
Email Alerts and Reports
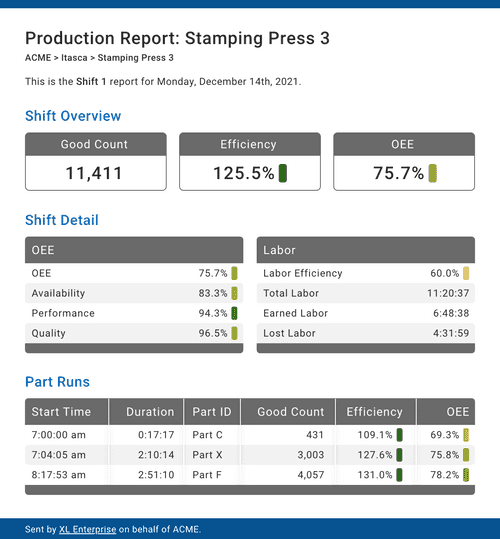
Extend the idea of real-time data capture to real-time email alerts and reports. Have data from the shop floor automatically delivered to your email inbox by subscribing to the alerts and reports that are most important to you.
- Email Alerts are ideal for quickly responding to emerging issues
- Email Reports are ideal for retrospective summaries
Subscribe to:
- Email Alerts for production lines that fall within your area of responsibility, and set escalation triggers appropriate for your role
- Email Reports that include production data from multiple production lines for a convenient one-stop retrospective summary
To summarize, email alerts and reports make it much easier for you to keep tabs on your processes, both for emerging issues and for analytical retrospectives, without having to sift through information in which you have no interest.
Start a Free Production Monitoring Trial Today
The Vorne XL Productivity Appliance™ is an advanced IIoT device that seamlessly integrates data capture, real-time production monitoring, a plant floor scoreboard, and a robust production reporting system into one platform for rapidly and dramatically driving improvement at all levels of your manufacturing operation. From shop floor to top floor.
Our most popular model is $3,990 and includes unlimited users, unlimited reports, free software updates, free technical support, and an industry-leading 3-year warranty. There are over 42,000 XL installations across 45+ countries, and we encourage you to start with a free 90-day trial. Book a one-on-one webinar, and one of our product experts will be happy to explore the specifics of your application.
With XL you can easily:
- Gain instant access to 140+ real-time and historical metrics including OEE, Six Big Losses, Downtime, Labor Efficiency, and TEEP
- Empower operators to “win the shift” with an integrated real-time scoreboard
- Provide immediate insights for supervisors and managers with 50+ out-of-the-box reports
- Create the exact information you want, formatted the exact way you want it, with an unlimited number of custom dashboards
- Push alerts and email reports to key individuals to deliver the information they need when they need it
- Escalate alerts to proactively call attention to emerging issues
- Visualize all your production lines in a single view
- Understand OEE from a perspective that transforms OEE from a benchmark to a family of actionable metrics
- Add context to any production events with integrated comments
Already have XL? View the newest XL features for more information about what you can accomplish with Vorne XL as your production tracking system.


