Production Counters

Production Counting Systems in Manufacturing
Traditionally, production counting systems are used to keep track of the number of items produced in a plant. However, there is a lot more information, and a lot more useful information, that can be gleaned from these systems. Count sensors can be linked to OEE software capable of generating 100+ metrics from those sensor signals. This leads to the distinction between production counters and production monitors.
Why Use Production Counters?
Every manufacturer needs an accurate count of what they produce. It's a given. However, what is less understood is that production counters can be used for much more than just counting – they can be used to drive significant improvements in manufacturing productivity. What do we mean by this? The same sensors used for counting parts can be used to generate dozens of meaningful and insightful metrics that provide a comprehensive window into your manufacturing operations. Consider this:
- A Production Counter tells you how much you made
- A Production Monitor tells you how much you made AND it helps you make more
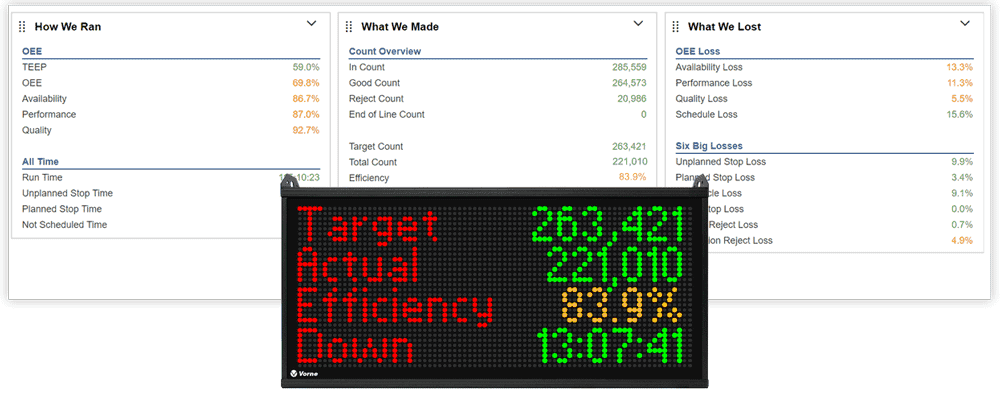
Using the same two sensors one might use for production counting (Total Count and Good Count) a production monitor can automatically track Counts, Rates, Cycle Times, Production Times, OEE, Six Big Losses, TEEP, and Targets.

How does it work? It's simple. Enter your shift schedule (to establish Planned Production Time) and scan a barcode for the start and end of Changeovers (to capture Planned Stop Time). Provide two sensors from your manufacturing process, and two pieces of information for each part:
- Total Count Sensor
- Good (or Reject) Count Sensor
- Ideal Cycle Time
- Takt Time (optional)
Start with a Total Count Sensor to get the following metrics, which include highly accurate production times since the production monitor automatically detects when the manufacturing process is down:
| Category | Metrics |
|---|---|
| Counts | Total Count |
| Rates | Production Rate (both instantaneous and average) |
| Cycles | Total Cycles, Current Cycle Time, Previous Cycle Time, and Average Cycle Time |
| Production Times | Run Time, Unplanned Stop Time, Planned Stop Time, and Not Scheduled Time (each with time, occurrence, and percentage metrics) |
Add a Good (or Reject) Count Sensor to get quality information:
| Category | Metrics |
|---|---|
| Counts | Good Count, Reject Count, and First Pass Yield |
| Rates | Good Rate and Reject Rate (both instantaneous and average) |
Add Ideal Cycle Time (the theoretical minimum time to produce one part) to open up an entirely new dimension of cycle, performance, and capacity analytics:
| Category | Metrics |
|---|---|
| Cycles | Standard Cycles, Slow Cycles, and Small Stops (each with time, occurrence, and loss metrics) |
| OEE | OEE, Availability, Performance, and Quality (each with percentage, time, and count-based loss metrics), Fully Productive Time, and Total Loss |
| Six Big Losses | Breakdowns (Unplanned Stop Time), Setup and Adjustments (Planned Stop Time), Reduced Speed (Slow Cycles), Small Stops, Startup Rejects, and Production Rejects (each with percentage, time, and count-based loss metrics) |
| TEEP | TEEP, Utilization, Capacity Loss, Capacity Lost Time |
Add Takt Time (the expected time to produce one good piece) for real-time metrics that enable your plant floor team to “win their shift”:
| Category | Metrics |
|---|---|
| Target | Target Count, Efficiency, Percent Variance, Count Variance, Time Variance, Pace Time, Takt Time, Takt Compliance, and Takt Overage |
Production monitors are really that straightforward. That's why whenever someone wants to implement a production counting system, we recommend they seriously consider upgrading to a production monitor. As an added bonus, many production monitors also offer in-depth historical analytics (see below).
Look at it this way. Good decisions are based on good information. Great decisions are based on even better information. By leveraging the same two sensors you use for production counting you can greatly expand your world of information.

Types of Production Counters
There are a variety of different kinds of production counters used in manufacturing. Here are three common types:
| Type | How It's Used |
|---|---|
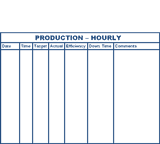
| Whiteboard | Portable (on wheels) or fixed (wall-mounted) writable boards. Whiteboards are typically updated at the start of each day, at the start of each shift, or hourly (optimal). Posted information typically includes counts, down time, and targets. Whiteboards convey a lot of information, but the information is manually captured and not updated in real-time. |
| Electronic Counter | Plant floor counter showing production counts for the day or shift. Some electronic counters alternate between showing production count and production speed (rate). |
| Production Monitor | Plant floor production monitors that use the same sensors as electronic counters but develop a far richer set of information. The most effective production monitors:
|
How to Use A Production Counting System
An effective production counter provides an accurate count of what is produced. An effective production monitor drives improvement at all levels of the company. For example:
- Operational improvement can be achieved by enabling plant floor employees to “win their shift”:
| Convey | By Asking... | Metric | Description |
|---|---|---|---|
| Expectation | Where should we be? | Target | Quantity of good parts that should have been manufactured. |
| Performance | Where are we? | Actual | Quantity of good parts that have been manufactured. |
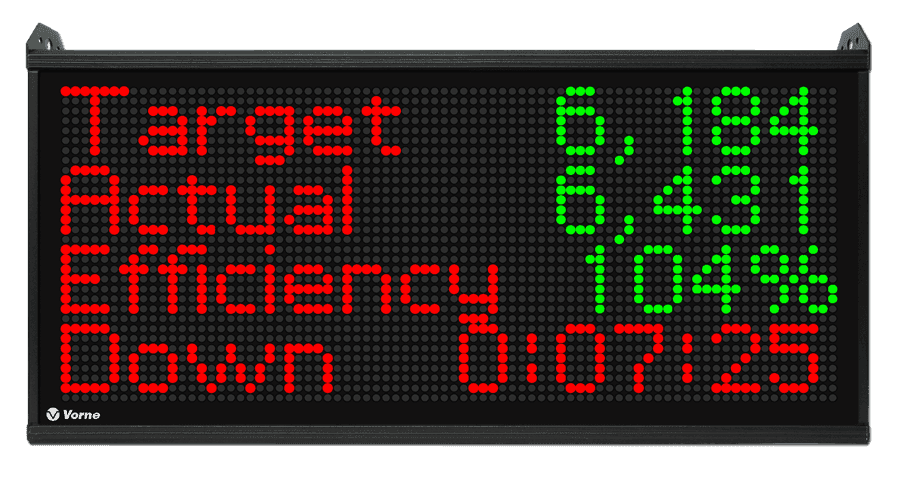
| Achievement | How are we doing? | Efficiency | Ratio of Actual to Target. An Efficiency score of 100% or better means your team is winning their shift. |
Tactical improvement can be achieved by providing supervisors with “quick win” analytics tools such as Top Losses and Short Interval Control.
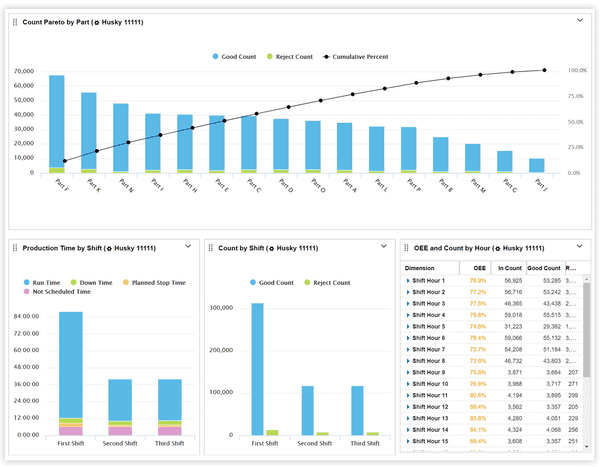
Strategic improvement can be achieved by providing managers with accurate and trended historical information that puts all manufacturing losses in one actionable context (as shown above).
The same two sensors used for a production counter can generate dozens of insightful metrics right out-of-the-box when connected to a production monitor. Use a production monitor to display a simple set of real-time metrics on the plant floor (e.g., Target, Actual, Efficiency, and Down Time) and to deliver key historical metrics and analytics to supervisors and managers (e.g., OEE, Six Big Losses, and TEEP).
Production Counter Selection Chart
The following selection chart highlights some of the many advantages of using the Vorne XL Productivity Appliance™ as a "supercharged" production counter. We like to think of XL as the ultimate production counter!
| Advantage | Whiteboard | Electronic Counter | Vorne XL Productivity Appliance™ |
|---|---|---|---|
 |  |  | |
| Affordable | ✔ | ✔ | ✔ |
| Highly Visible | ✔ | ✔ | |
| Engages Operators | ✔ | ✔ | ✔ |
| Automates Data Capture | ✔ | ✔ | |
| Real-Time Information | ✔ | ✔ | |
| Historical Analytics | ✔ | ||
| Browser-Based Reports | ✔ | ||
| Count Metrics | ✔ | ✔ | ✔ |
| Rate Metrics | ✔ | ✔ | |
| Cycle Metrics | ✔ | ||
| Production Time Metrics | ✔ | ||
| OEE Metrics | ✔ | ||
| Six Big Loss Metrics | ✔ | ||
| TEEP/Capacity Metrics | ✔ | ||
| Target Metrics | ✔ | ✔ |

