Machine Monitoring

What Is Machine Monitoring?
In manufacturing, machine monitoring is the method of using sensors to collect data from key pieces of equipment in your manufacturing process. In any given process, the most important manufacturing equipment to monitor is the constraint.
Machine monitoring provides you with real-time visibility into your manufacturing operations - visibility that helps drive improvement from top floor to shop floor.
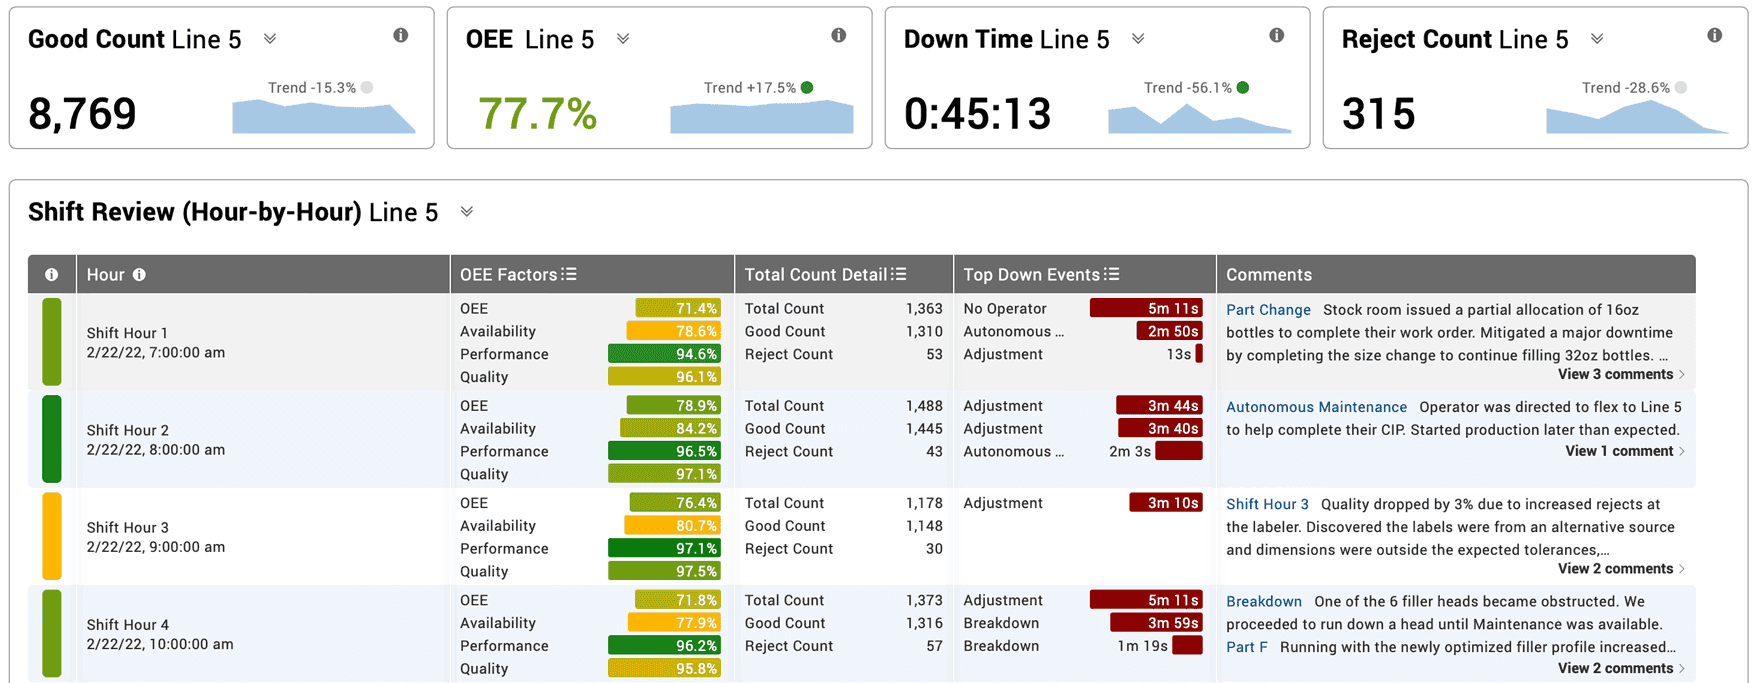
Data collection from sensors, combined with machine monitoring software, enables you to view and analyze production data, transforming real-time data into historical data and analytics. Done correctly, this will provide you with a broad range of actionable information regarding your manufacturing processes, including a complete set of OEE and TEEP loss metrics, and insights as to where the most impactful improvements can be made to your process.

How Does Machine Monitoring Work?
The ultimate goal of machine monitoring is to gain a deep understanding of all aspects of your manufacturing process, enabling you to view in-depth production data at the machine, plant, and enterprise levels.
Amazingly, with only two or three sensors, data for over 100 actionable and meaningful metrics can be generated and distilled into easily digestible reports, and even more importantly, a foundation for action.
Managers, supervisors, and operators each have a unique role in ensuring that a machine monitoring system is used effectively.
The Role of the Plant Manager
During planning and preparation, we recommend that the plant manager reviews their top-level business objectives to determine the manufacturing KPIs on which to focus. A good question to ask is: Which KPI should we improve to make the largest business impact?
Another key responsibility of the plant manager during planning and preparation is to define the underlying policies and standards associated with the machine monitoring system. For example, standards might include:
- Capture a reason for every down event.
- Capture a comment for every down event longer than 15 minutes.
- Measure changeover time as last good piece (previous part) to first good piece (next part).
After implementation, the role of the plant manager is to monitor top-level KPIs, such as OEE and TEEP. We recommend that plant managers focus less on KPI values and more on KPI trends to gauge the rate of improvement. Plant managers are then in a good position to make adjustments to strategy if they do not see the desired rate of improvement.
The Role of Line Supervisors
During planning and preparation, we recommend that line supervisors determine the best points of the manufacturing process from which to capture automated data (usually the constraint of the process). There may also be some data that should be captured manually, such as explanatory comments from operators regarding truly unusual circumstances like very long down events or changeovers that are well beyond their target time. In such cases, we recommend that the line supervisor create standardized work procedures and train operators on these procedures so that all data is consistently captured.
After implementation, one of the most important roles of line supervisors is to analyze the data collected and make adjustments to tactics to improve specific metrics. We also recommend that line supervisors pay close attention to engaging with and motivating plant-floor operators, especially in the context of meeting or exceeding targets, or as we like to refer to it, “winning the shift.”
The Role of Plant Floor Operators
During planning and preparation, we recommend that operators are trained on any new processes. Beyond learning procedures, ensuring that operators understand why their work is important in relation to the company’s greater strategy is crucial to obtaining buy-in and a sense of purpose. It can be difficult to adapt to changes in work procedures, so ensuring operators understand how and why their contributions matter will help keep them engaged and motivated.
After implementation, the role of plant floor operators is to use real-time machine data to make decisions and adjustments during their shift. For the best results, we recommend a plant floor scoreboard be hung within view of operators to show real-time production data and provide operators with a direct visual feedback loop on their actions. After all, real-time machine monitoring is only helpful if the data collected is readily available so action can be taken to make improvements.
Why Is Machine Monitoring Important?
Machine monitoring adds a tremendous amount of value because it transitions decisions and actions from subjective to objective, from assumption-driven to data-driven. In other words, machine monitoring, when implemented properly, results in comprehensive, highly accurate, and objective data that can be easily shaped into insightful actions. It creates a single source of truth and provides the foundation for your manufacturing improvement roadmap.
It Creates a Rich Data Foundation
Machine monitoring creates a rich and connected data foundation comprised of a broad range of metrics. Here are some examples of metrics that can be generated from just two or three sensors.
| Metric Category | Representative Examples |
|---|---|
| Six Big Losses | Down Loss, Cycle Loss, Startup Reject Loss |
| Counts | Good Count, Reject Count, Startup Rejects |
| Rates | In Rate, Target Rate, Rate Efficiency |
| Labor | Labor per Good Piece, Earned Labor, Lost Labor |
| OEE | OEE Loss, Availability Loss, Performance Loss, Quality Loss |
| Cycles | Run Cycles, Equipment Cycles, Small Stop Lost Time |
| Production Times | Run Time, Down Time, Planned Stop Time |
| Target | Target Count, Efficiency, Count Variance |
| TEEP | Utilization, Schedule Loss, Hidden Factory Time |
The result of implementing a machine monitoring system is achieving a consistent data foundation across your manufacturing equipment from which all employees can draw upon and make data-driven decisions. We like to refer to this as creating a “data democracy.”
We also think it’s important to emphasize the difference between “data” and “information.” Machine monitoring begins with data collection, but the goal is to leverage that data into actionable information.

It Generates Accurate and Unbiased Data in Real Time
Another significant benefit provided by machine monitoring is highly accurate and unbiased data. Since it makes data collection a largely automated process, machine monitoring removes the elements of human error and unconscious bias. And since data is delivered in real time, your team can transition from being reactive (acting after the fact) to being proactive (responding immediately).
In our experience, companies usually have a reasonably accurate understanding of their quality losses. On the other hand, companies are often shocked when they discover the true extent of their downtime and how much manufacturing time is lost to slow cycles and small stops. While it can be a bit unsettling at first, it is necessary to have an accurate understanding of your manufacturing production losses in order to effectively address them.
It Empowers Your Team to Take Action with Confidence
Once you have a foundation of timely and accurate information, you are well-positioned to leverage that information into results. We highly recommend the IDA framework (Information, Decision, Action) as an easy and effective way to transform information generated by machine monitoring into results that boost your bottom line.
Machine monitoring provides your team with the ability to look forward towards progress rather than looking backward at missed opportunities. Monitoring manufacturing production without taking action provides no benefit to your processes or bottom-line profitability. But, taking action is also where many companies falter. It is much easier to consistently collect data than to consistently take action on that data. That is why organizing data into actionable information is so important. For example, when data is organized into Top Losses, it is immediately clear where improvements will have the biggest impact.

A simple but effective improvement strategy is to select the largest production loss where: your team has ideas on actions that they can take, minimal external resources are required, and actions can be taken right away.
It Adds Value to Integrations
Machine monitoring systems add even more value when integrated with your ERP or MES system. There are two key integration points.
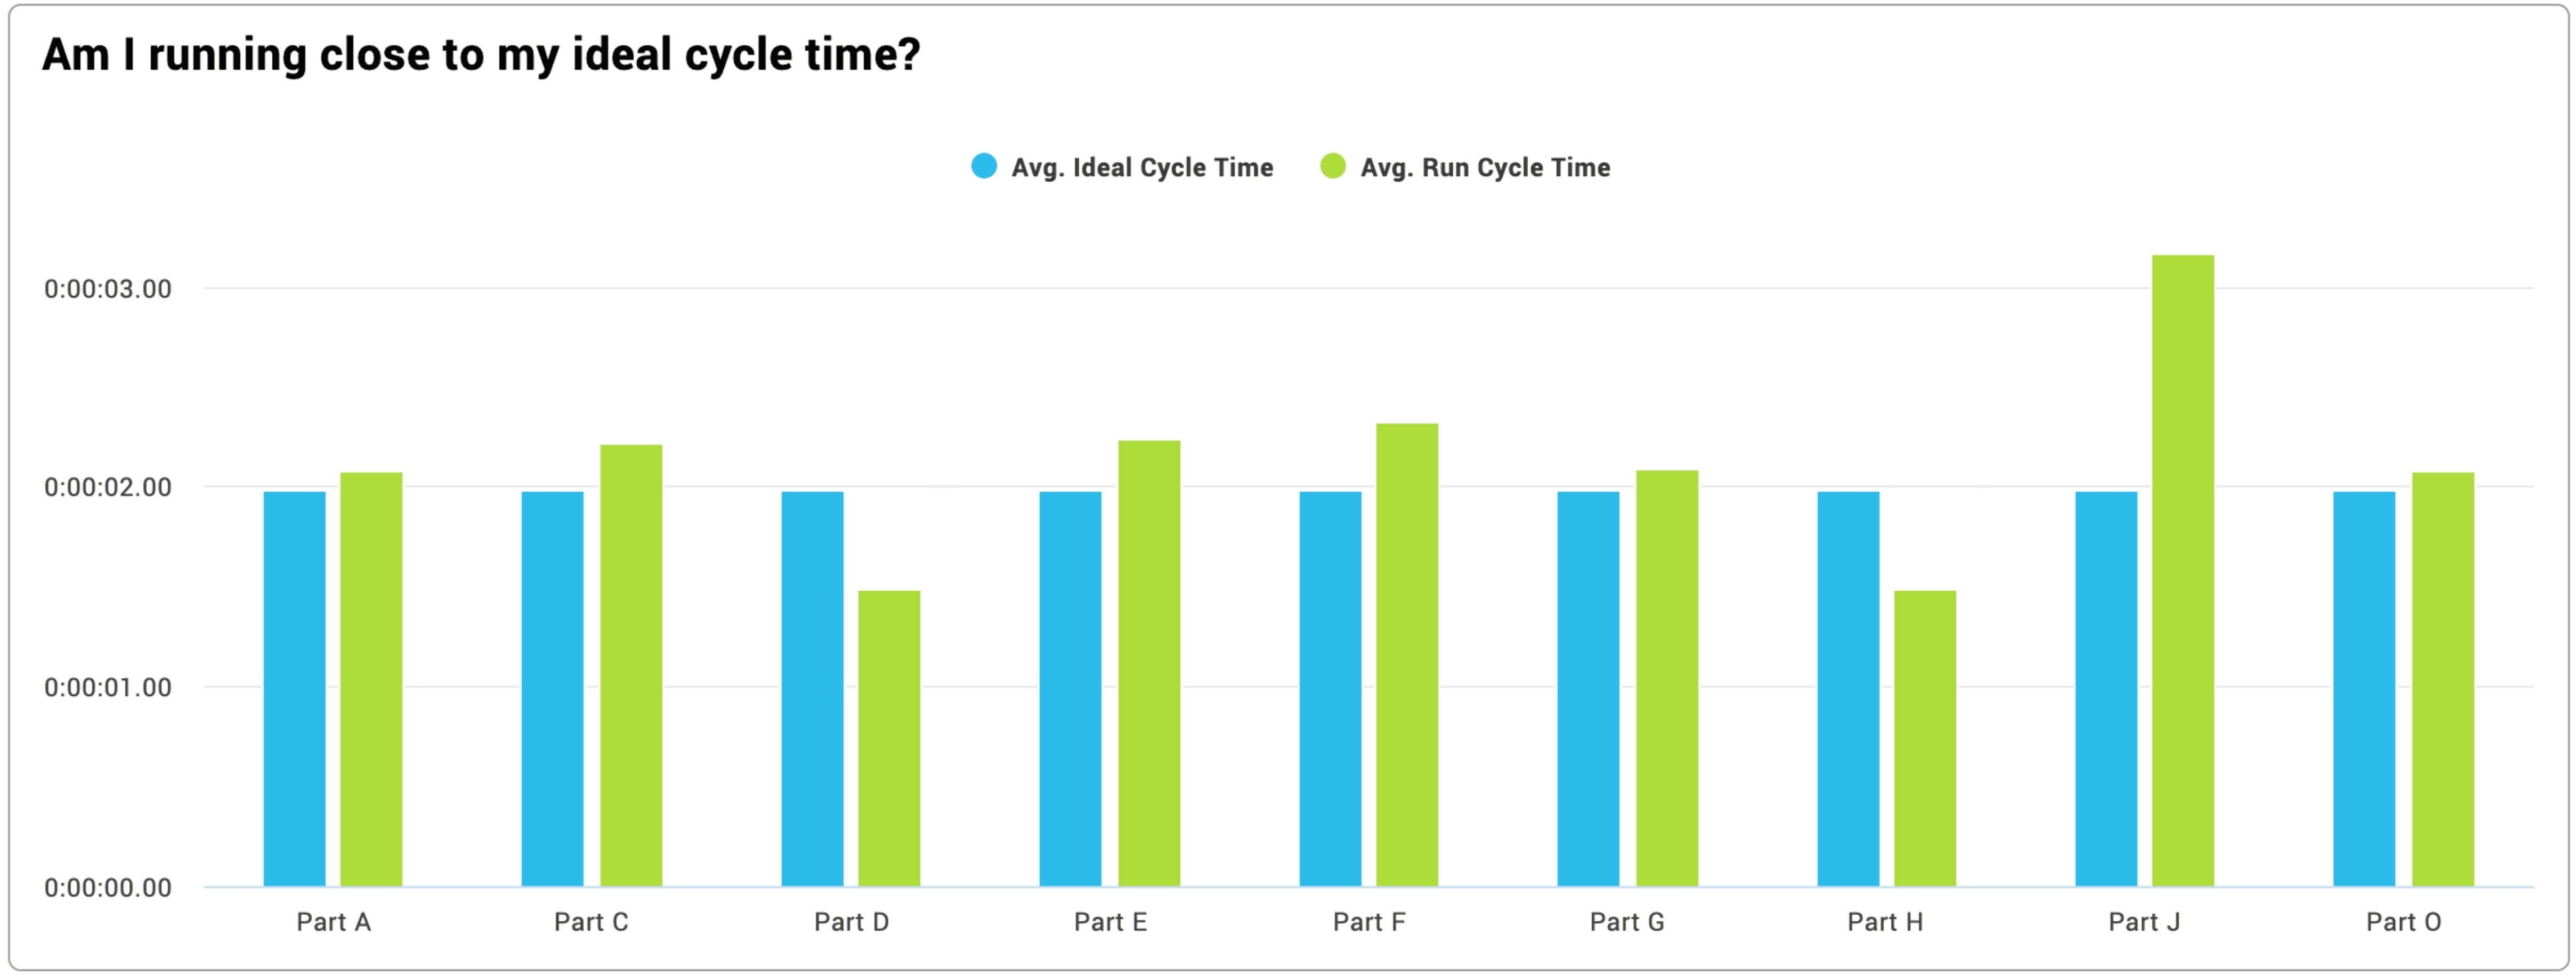
The first integration point is having your ERP or MES provide key values, such as Ideal Cycle Time or Takt Time, to your machine monitoring system so metrics are calculated based on existing company standards. One note of caution: be sure that values used for Ideal Cycle Time do not include any budgeted losses. The single most common cause of inaccurate OEE scores is Ideal Cycle Times that are too high. Machine monitoring software can notify you of this with real-time alerts or through historical analytics by detecting when Run Cycle Times are faster than Ideal Cycle Times or by detecting when OEE Performance is over 100%.

The second integration point is transferring KPIs for completed jobs or part runs to your ERP or MES so job and part number costing is accurate, and so you have more accurate data for scheduling.
What Are Some Different Types of Machine Monitoring?
Machine Monitoring for Different Manufacturing Processes
Machine monitoring is applicable to a very broad range of manufacturing processes, particularly in discrete manufacturing. For example, stamping, bottling, labeling, packaging, molding, assembly, forming, and printing are all within the scope of machine monitoring.
The especially interesting aspect of this is that almost any type of discrete manufacturing process can be monitored in a similar way with similar metrics. This makes it easy to analyze and roll up data consistently across your entire plant or even across multiple plants.
The goal of all of these manufacturing process applications is the same - track machine data and leverage it to create positive change. How you do so (by tracking losses using OEE and the Six Big Losses) and why you do so (to eliminate waste at the constraint) remains the same no matter what type of process you monitor.
Machine Monitoring for OEE
OEE machine monitoring is truly transformational. Why? It serves as an abstraction layer that enables you to view all of your manufacturing processes from a single lens of efficiency and effectiveness. OEE, or Overall Equipment Effectiveness, and related metrics, such as Six Big Losses and TEEP, were created to serve as machine monitoring metrics, hence the equipment part of Overall Equipment Effectiveness.
OEE machine monitoring also has a very low barrier to entry. You can get started with just two sensors (monitoring Cycles and Good Count) and an Ideal Cycle Time for each part. This enables OEE software to generate a complete portfolio of OEE, Six Big Loss, and TEEP metrics.

Start a Free Machine Monitoring Trial Today
With the Vorne XL Productivity Appliance™ you can:
- Win the shift by motivating your operators with real-time targets and a plant-floor scoreboard
- Instantly access 100+ real-time metrics including OEE, Six Big Losses, and TEEP
- Provide supervisors and managers immediate insights with 50+ out-of-the-box reports
- Present information exactly as you want it with an unlimited number of custom reports
- Receive email alerts when your attention is needed on the plant floor
- Receive email shift reports at the end of each shift
The Vorne XL Productivity Appliance™ is an industrial IoT (IIoT) device that delivers all of this and much more. Our most popular model is $4,290 and includes unlimited users, free software updates, free technical support, and an industry-leading 3-year warranty. There are 42,000+ XL installations across 45+ countries, and we encourage all new applications to start with a free 90-day trial. Book a one-on-one webinar and one of our product experts will explore your application.


